
Text Solution
Verified by Experts
The correct Answer is:


Topper's Solved these Questions
PRESENTATION OF DATA - TEXTUAL AND TABULAR PRESENTATION
TARUN JAIN & VK OHRI|Exercise MULTIPLE CHOICE QUESTIONS|7 VideosPRESENTATION OF DATA - TEXTUAL AND TABULAR PRESENTATION
TARUN JAIN & VK OHRI|Exercise FILL IN THE BLANK|6 VideosORGANISATION OF DATA
TARUN JAIN & VK OHRI|Exercise EXERCISE NCERT|13 Videos
Similar Questions
Explore conceptually related problems
TARUN JAIN & VK OHRI-PRESENTATION OF DATA - TEXTUAL AND TABULAR PRESENTATION-ESSENTIAL PRATICALS
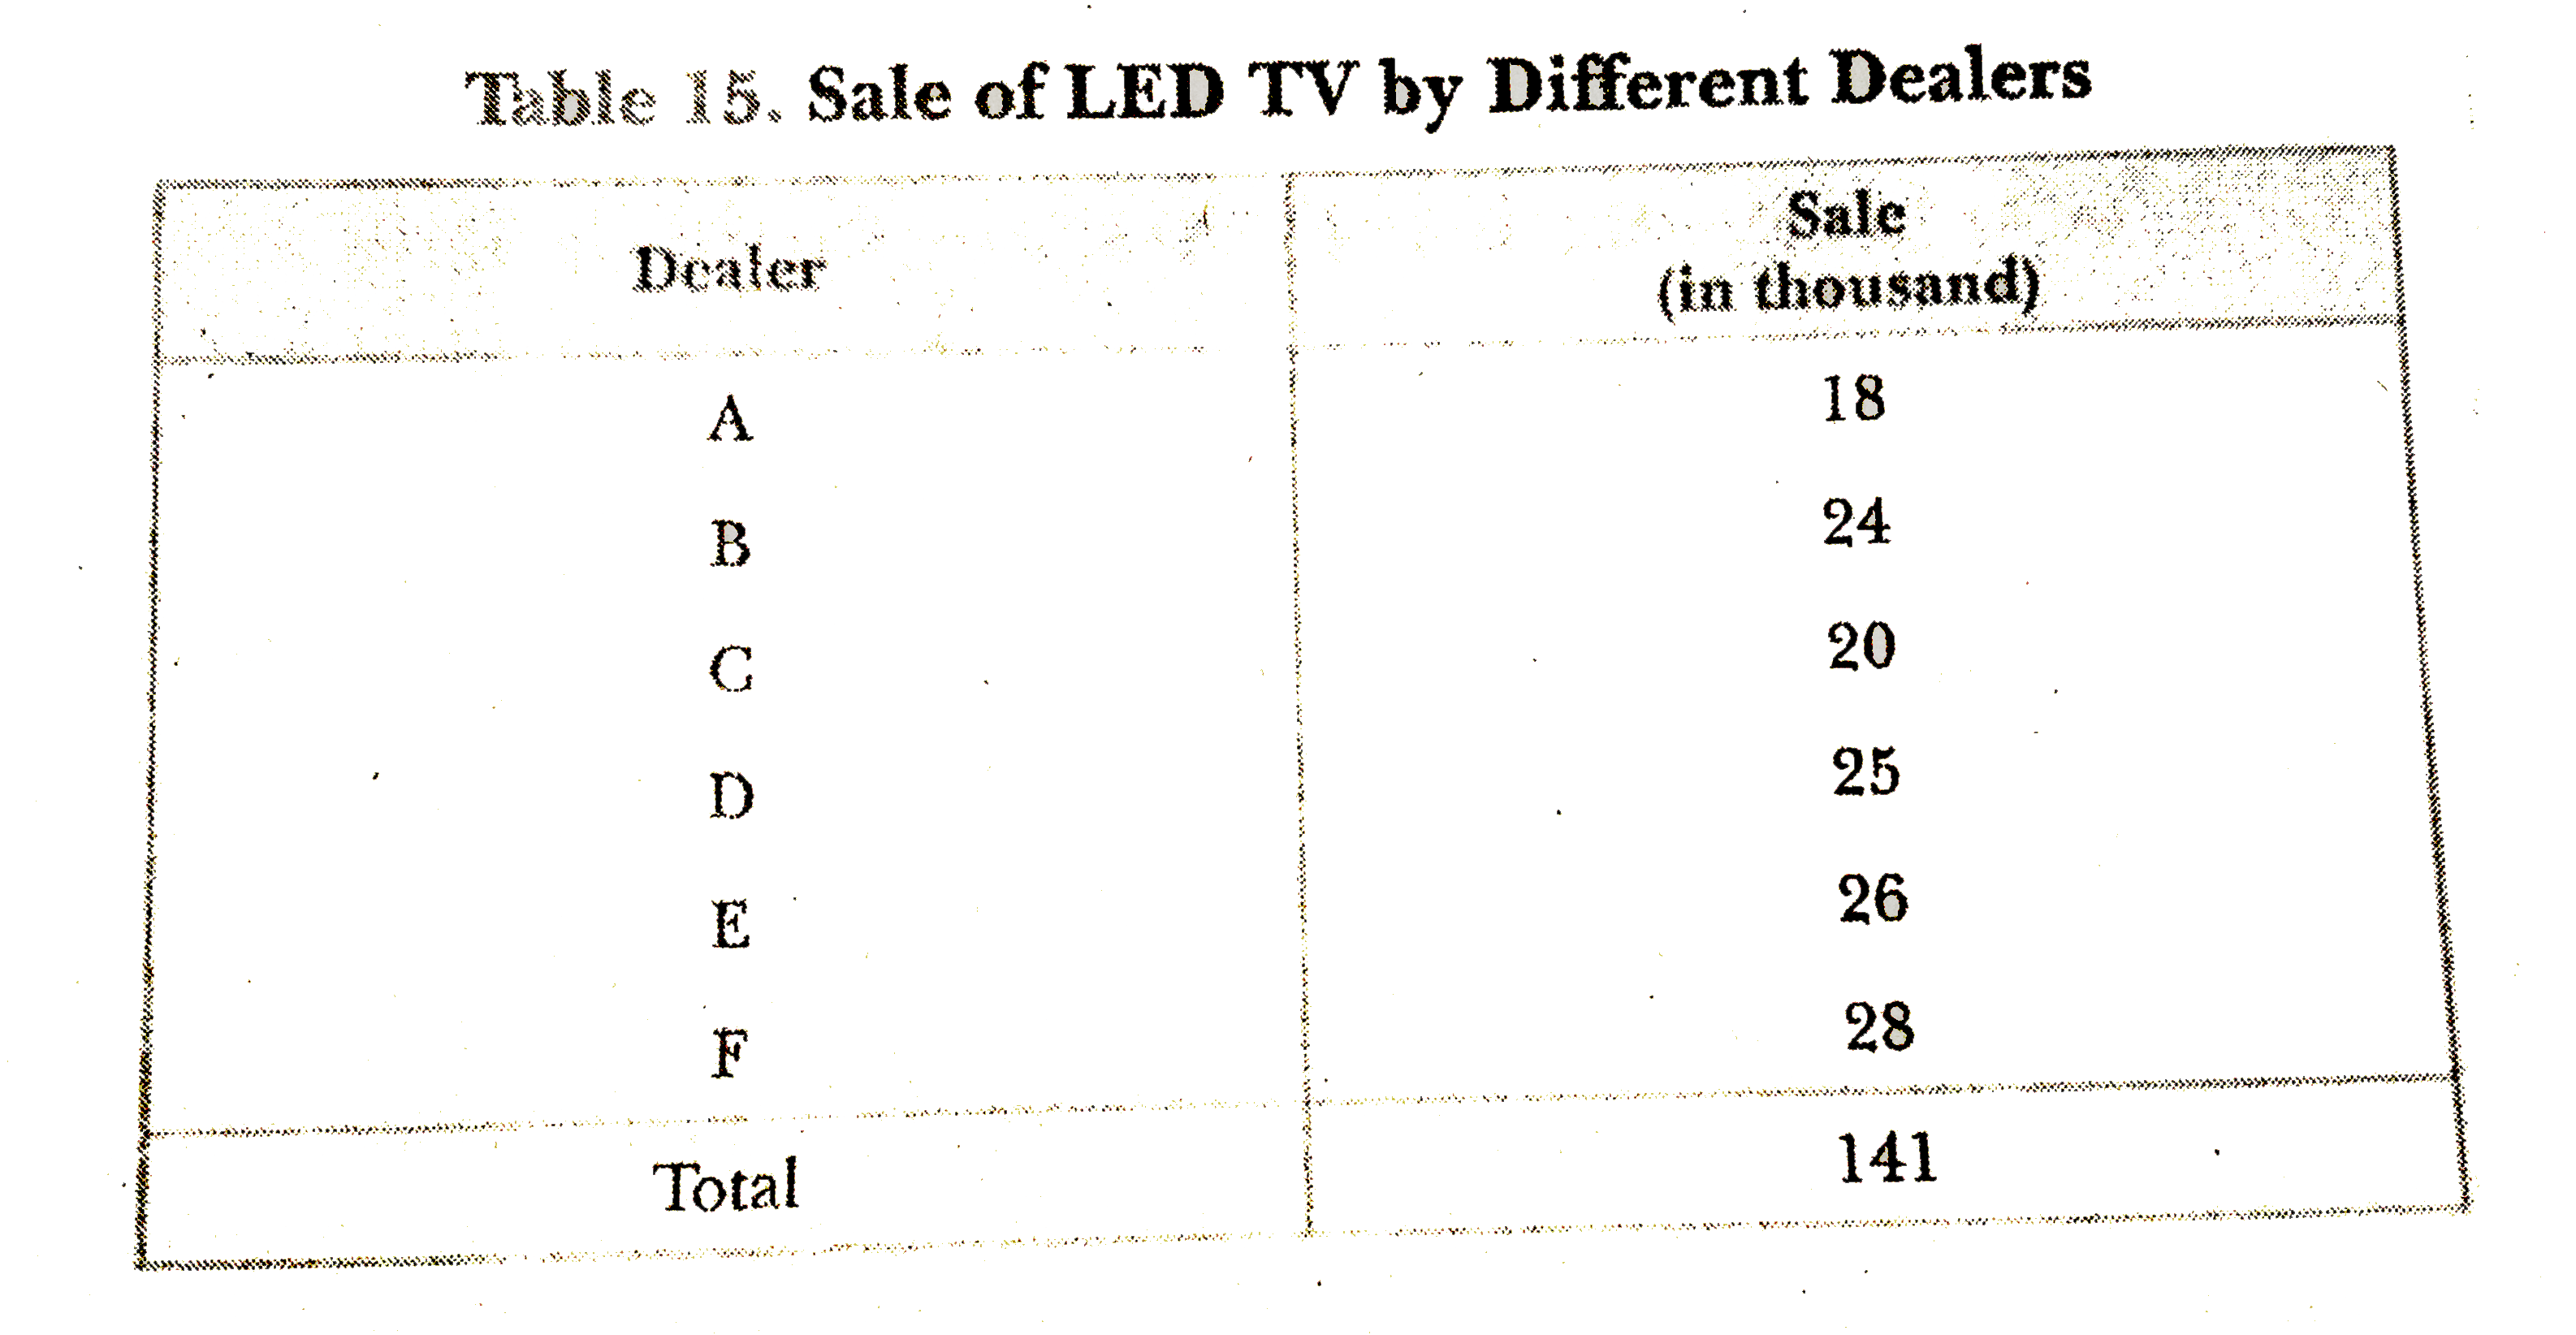
- Given the following data, draw a table showing the sale if LED TV by d...
Text Solution
|
- In 2016-17, the contibution of primary, secondary and tertiary sectors...
Text Solution
|
- Prepare a sketch of such a table that exhibits the following types of ...
Text Solution
|
- Following information relates to the exports form India to USSR and UK...
Text Solution
|
- Point out the mistakes in the following table, Rearrange it correctly.
Text Solution
|
- Following information relates to the marks secured by 50 students in e...
Text Solution
|
- Following information relates to the marks secured by 50 boys and girl...
Text Solution
|
- Draw a blank table to show the distribution of population according to...
Text Solution
|
- Present the following information in suitable tabular form: (i) In 2...
Text Solution
|