Text Solution
Verified by Experts


Similar Questions
Explore conceptually related problems
Recommended Questions
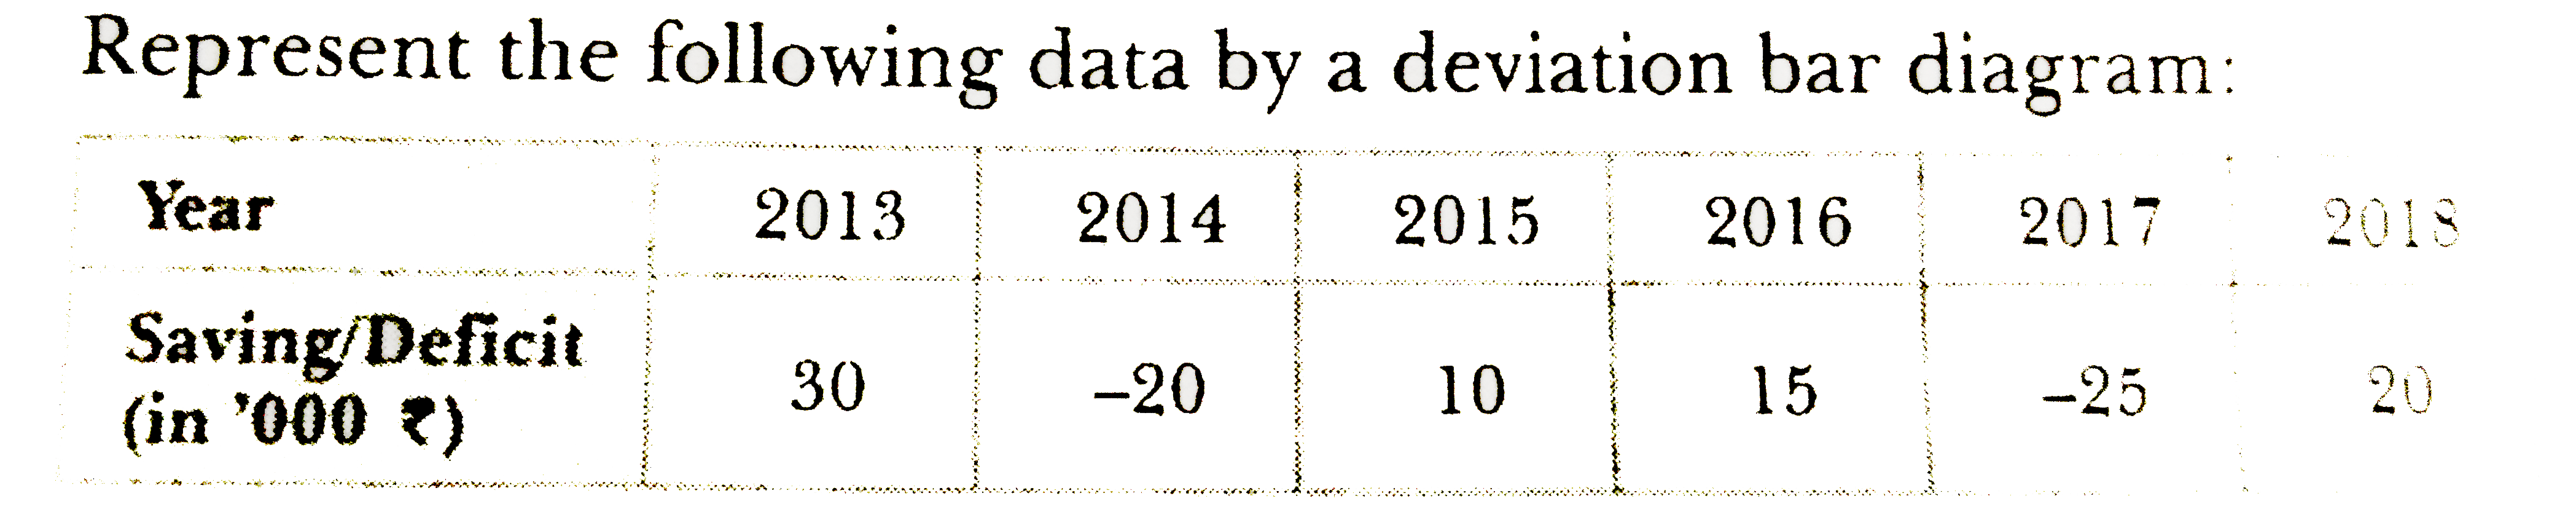
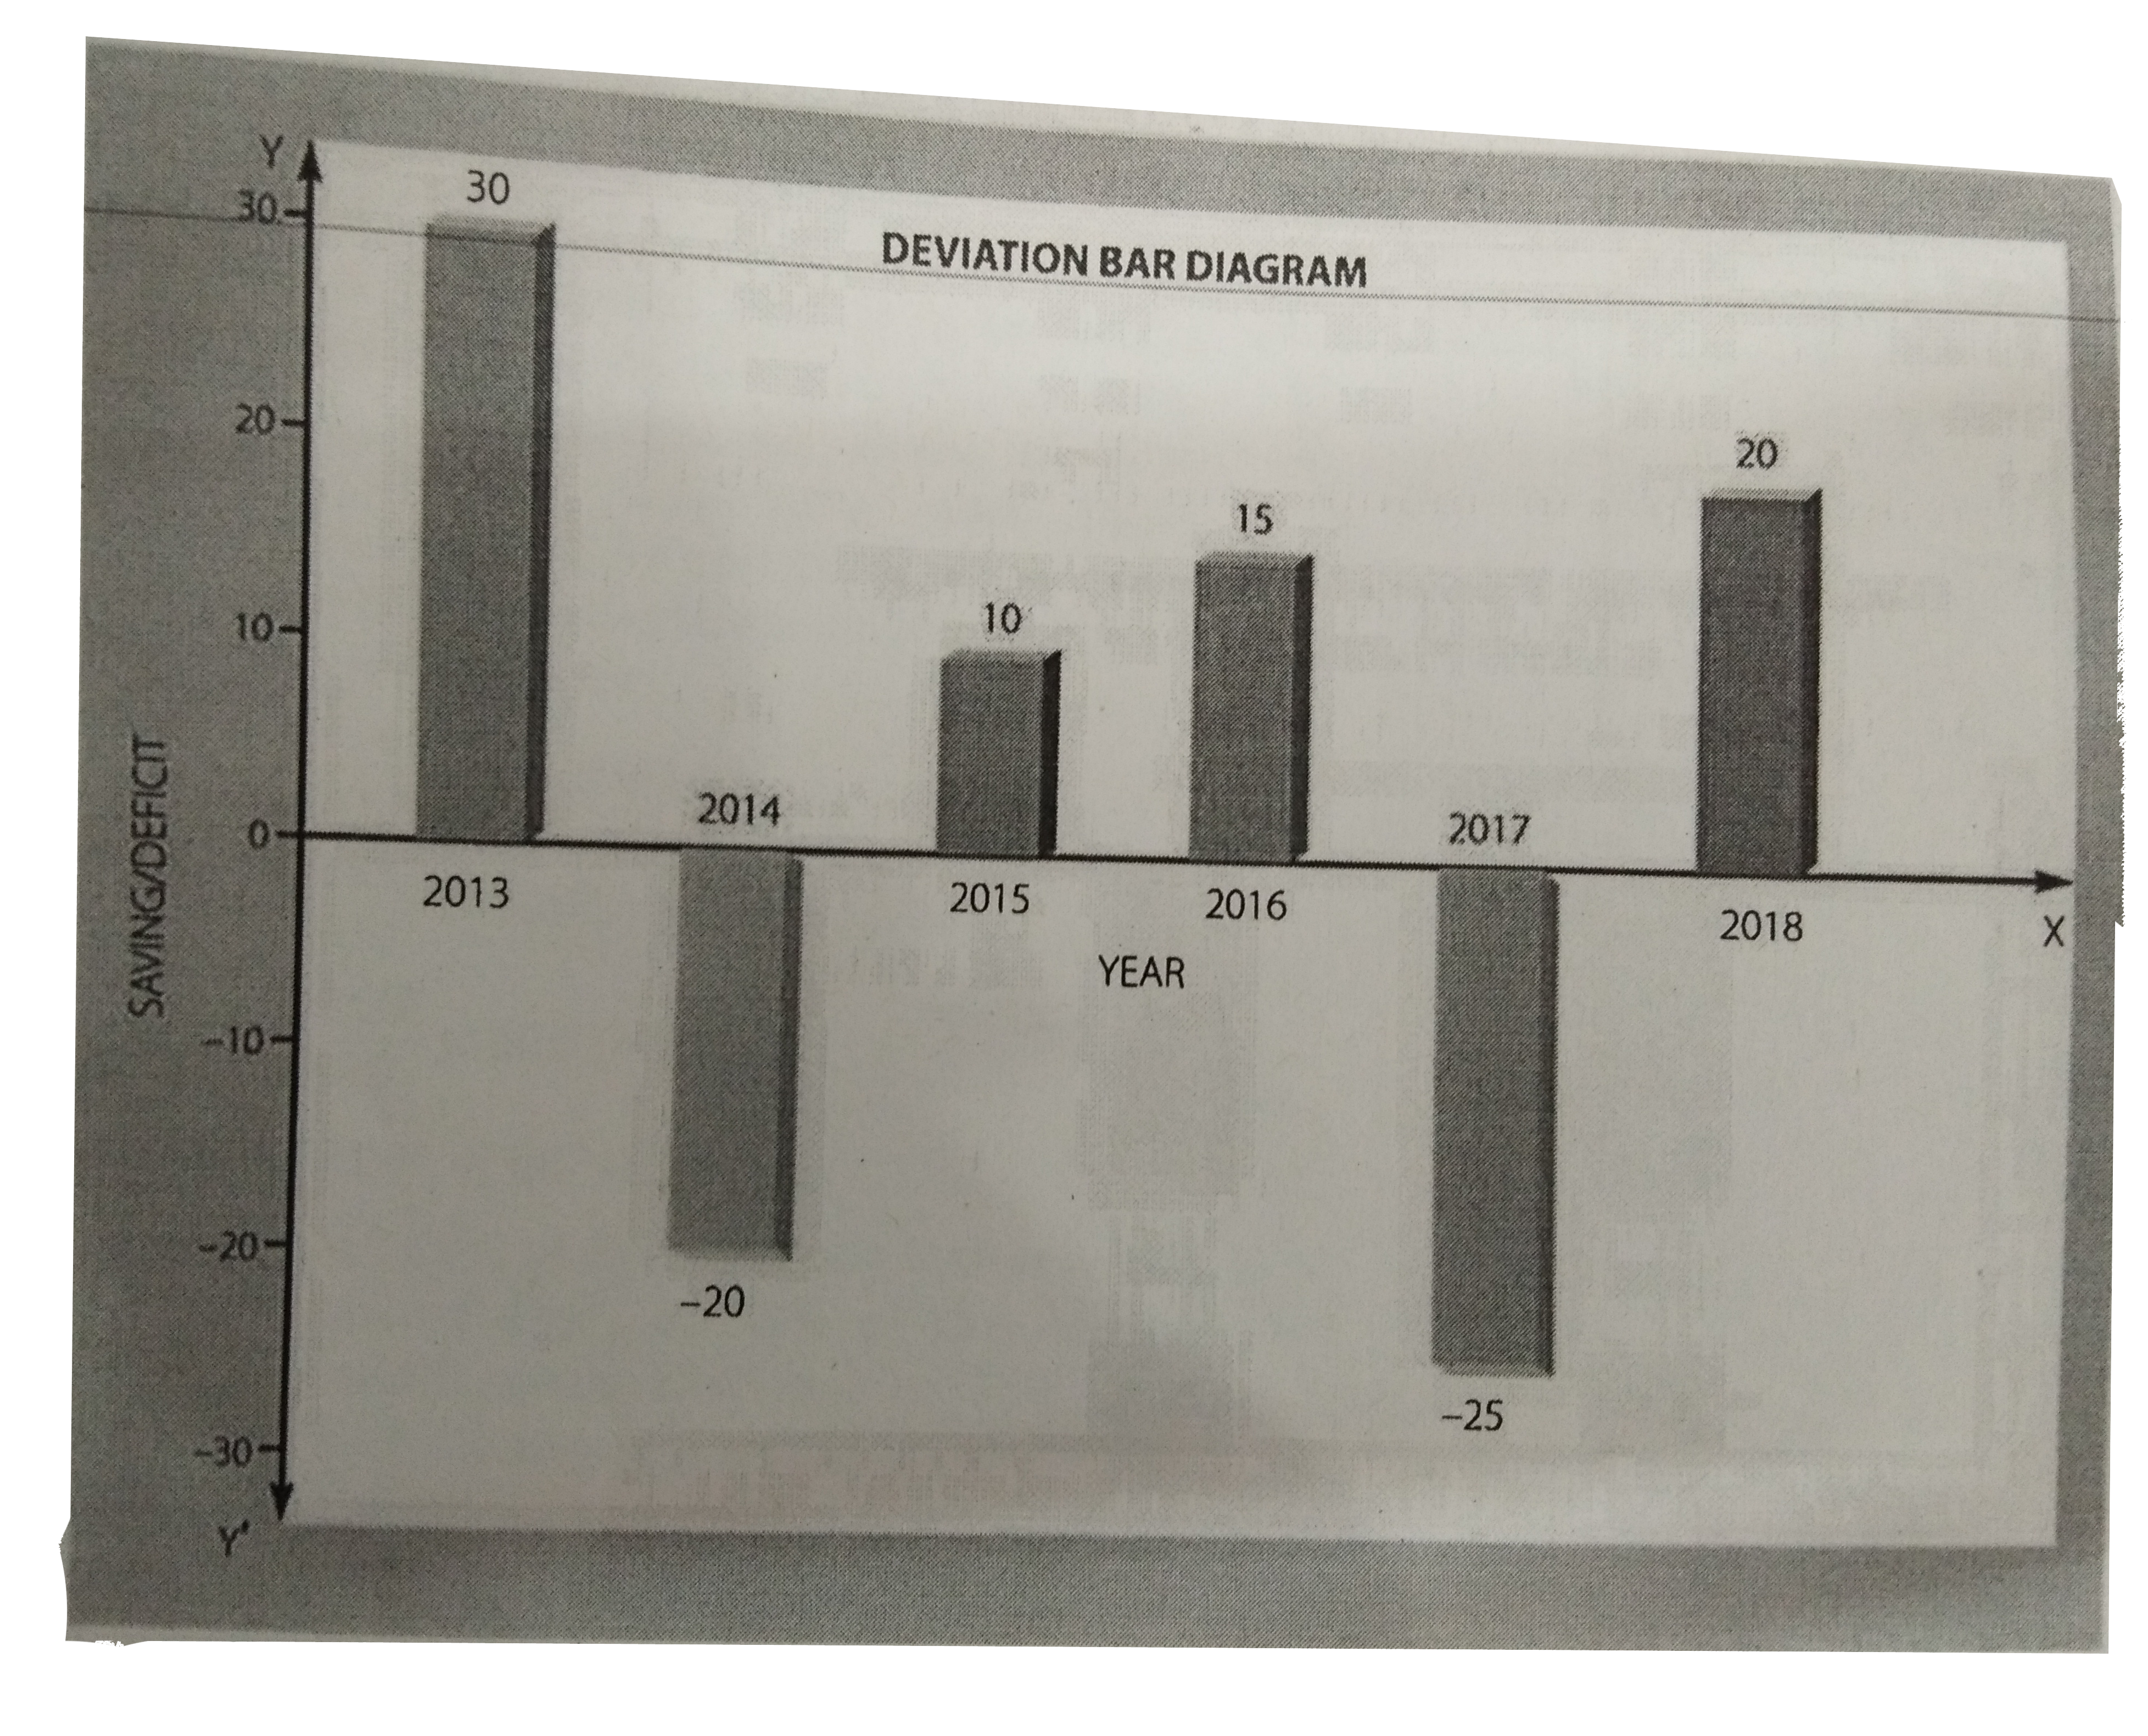
- Reprent the following data by a deviation bar diagram :
Text Solution
|
- प्रयोगशाला में क्लोरोफॉर्म बनाने की विधि का नामांकित चित्र सहित वर्णन ...
Text Solution
|
- निम्नलिखित में अनुचुंबकिय यौगिक है -
Text Solution
|
- निम्नलिखित में से किसकी अभिक्रिया से फॉस्फोरस से फोस्फीन बनायी जाती है...
Text Solution
|
- संलग्न चित्र में, यदि धारामापी G में कोई विक्षेप नहीं हैं तो एक दशा मे...
Text Solution
|
- चित्रानुसार एक दण्ड चुम्बक मुक्त रूप से एक कुण्डली के बीच से होकर गिरत...
Text Solution
|
- एक दण्ड चुम्बक को पतले तार द्वारा किसी समान चुम्बकीय क्षेत्र में लटकाय...
Text Solution
|
- प्रत्यावर्ती धरा जनित्र का सिद्धांत तथा कार्यप्रणाली चित्र द्वारा समझा...
Text Solution
|
- किसी प्रत्यावर्ती परिपथ में L ,C और R श्रेणीक्रम में जुड़े हैं ...
Text Solution
|