Home
Class 11
ECONOMICS
In 2011-12, Net Domestic Pdoduct by Indu...

In 2011-12, Net Domestic Pdoduct by Industry of origin (at 2004-05) is as given below. Present information in the form of a pic diagram.

Text Solution

Verified by Experts

Percentage value are vonverted into component parts of `360^(@)` of a circle, and then shown as different components of the circle.
Promotional Banner

Similar Questions

Explore conceptually related problems

For the year 2012-13 and 2013-14 value of gross domestic product at factor cost by the industry of origin is given in the following table. Prsent the information in the form of pie diagaram showing differences in the percentage contribution of different secotrs between the said years.

Gross Domestic Product by Industry of origin (at 2004-05 prices) is given for the years 2010-11 and 2011-12. Present this data in terms of percentage bar diagram.

Following data relate to the construction of a house in delhi .present the information in the form of a pie diagram:

The table below shows number of students of students of a college corresponding to different range of marks in Statistics. Present the information in the form of a histogram.

The number of hours spent by a school boy in different activities in a day is given below : Represent the above information using a pie diagram.

Following table shows production of a factory between January and June. Present the information in the form of a one variable time series graph. {:("Month","January","February","March","April","May","June"),("Production (Quintals)",5,7.5,5,10,12.5,15):}

The number of hours spent by a school boy in different activities in a day is given below: Represent the above information using pie diagram.

In the month of July 2004, a house holder spent his monthly salary amounting to Rs. 7200 on different items as given below: Items, Clothing, Food, House Rent, Education, Misc. Amount spent (in Rs.), 600, 4000, 1200, 400, 1000 Represent the information in the form of a pie-chart.

The percentages of various categories of workers in a state are given in the following table. Categories, Cultivators, Agricultural Labourers, Industrial Workers, Commercial Workers, Others % of workers, 40, 25, 12.5, 10, 12.5 Present the information in the form a pie-chart.

Recommended Questions
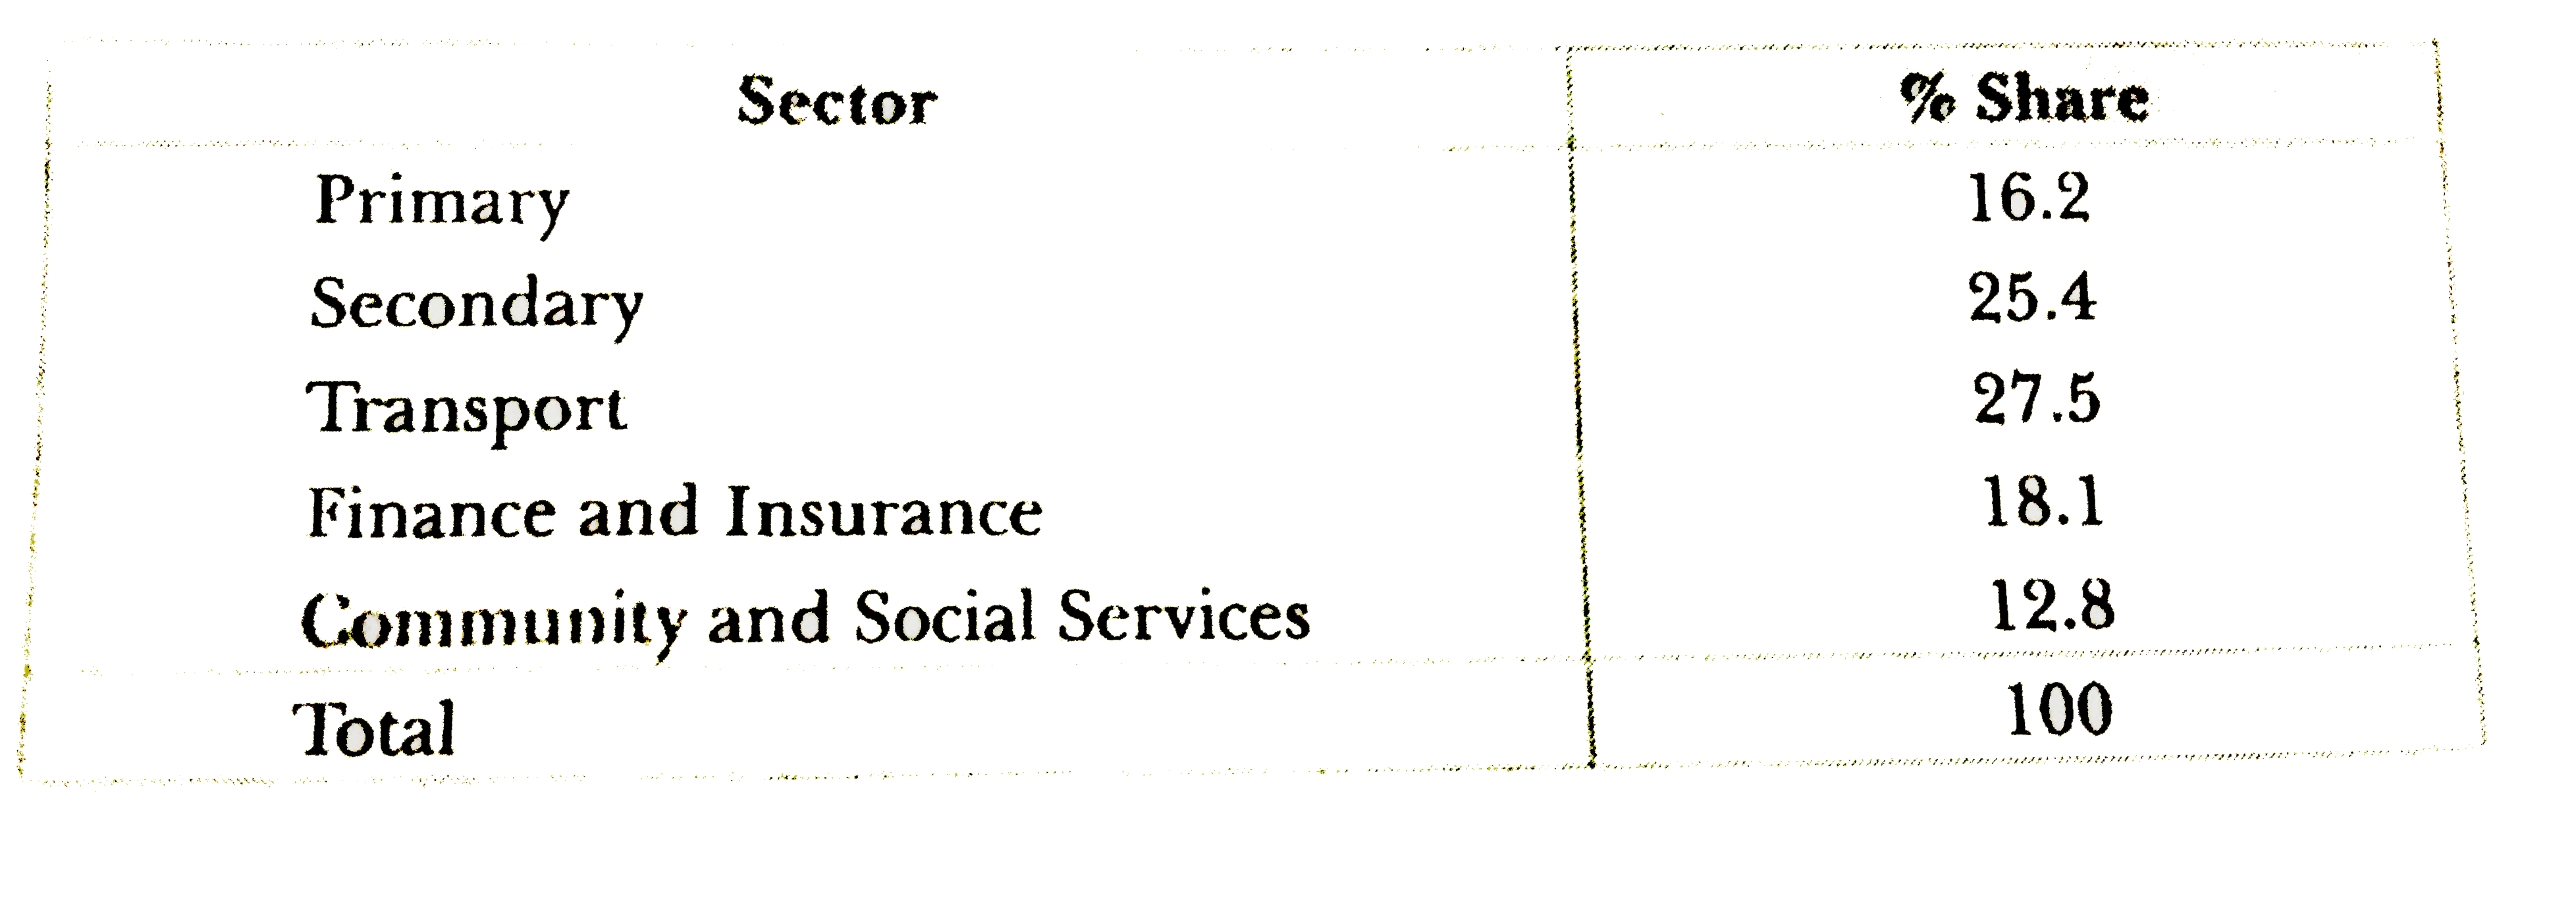
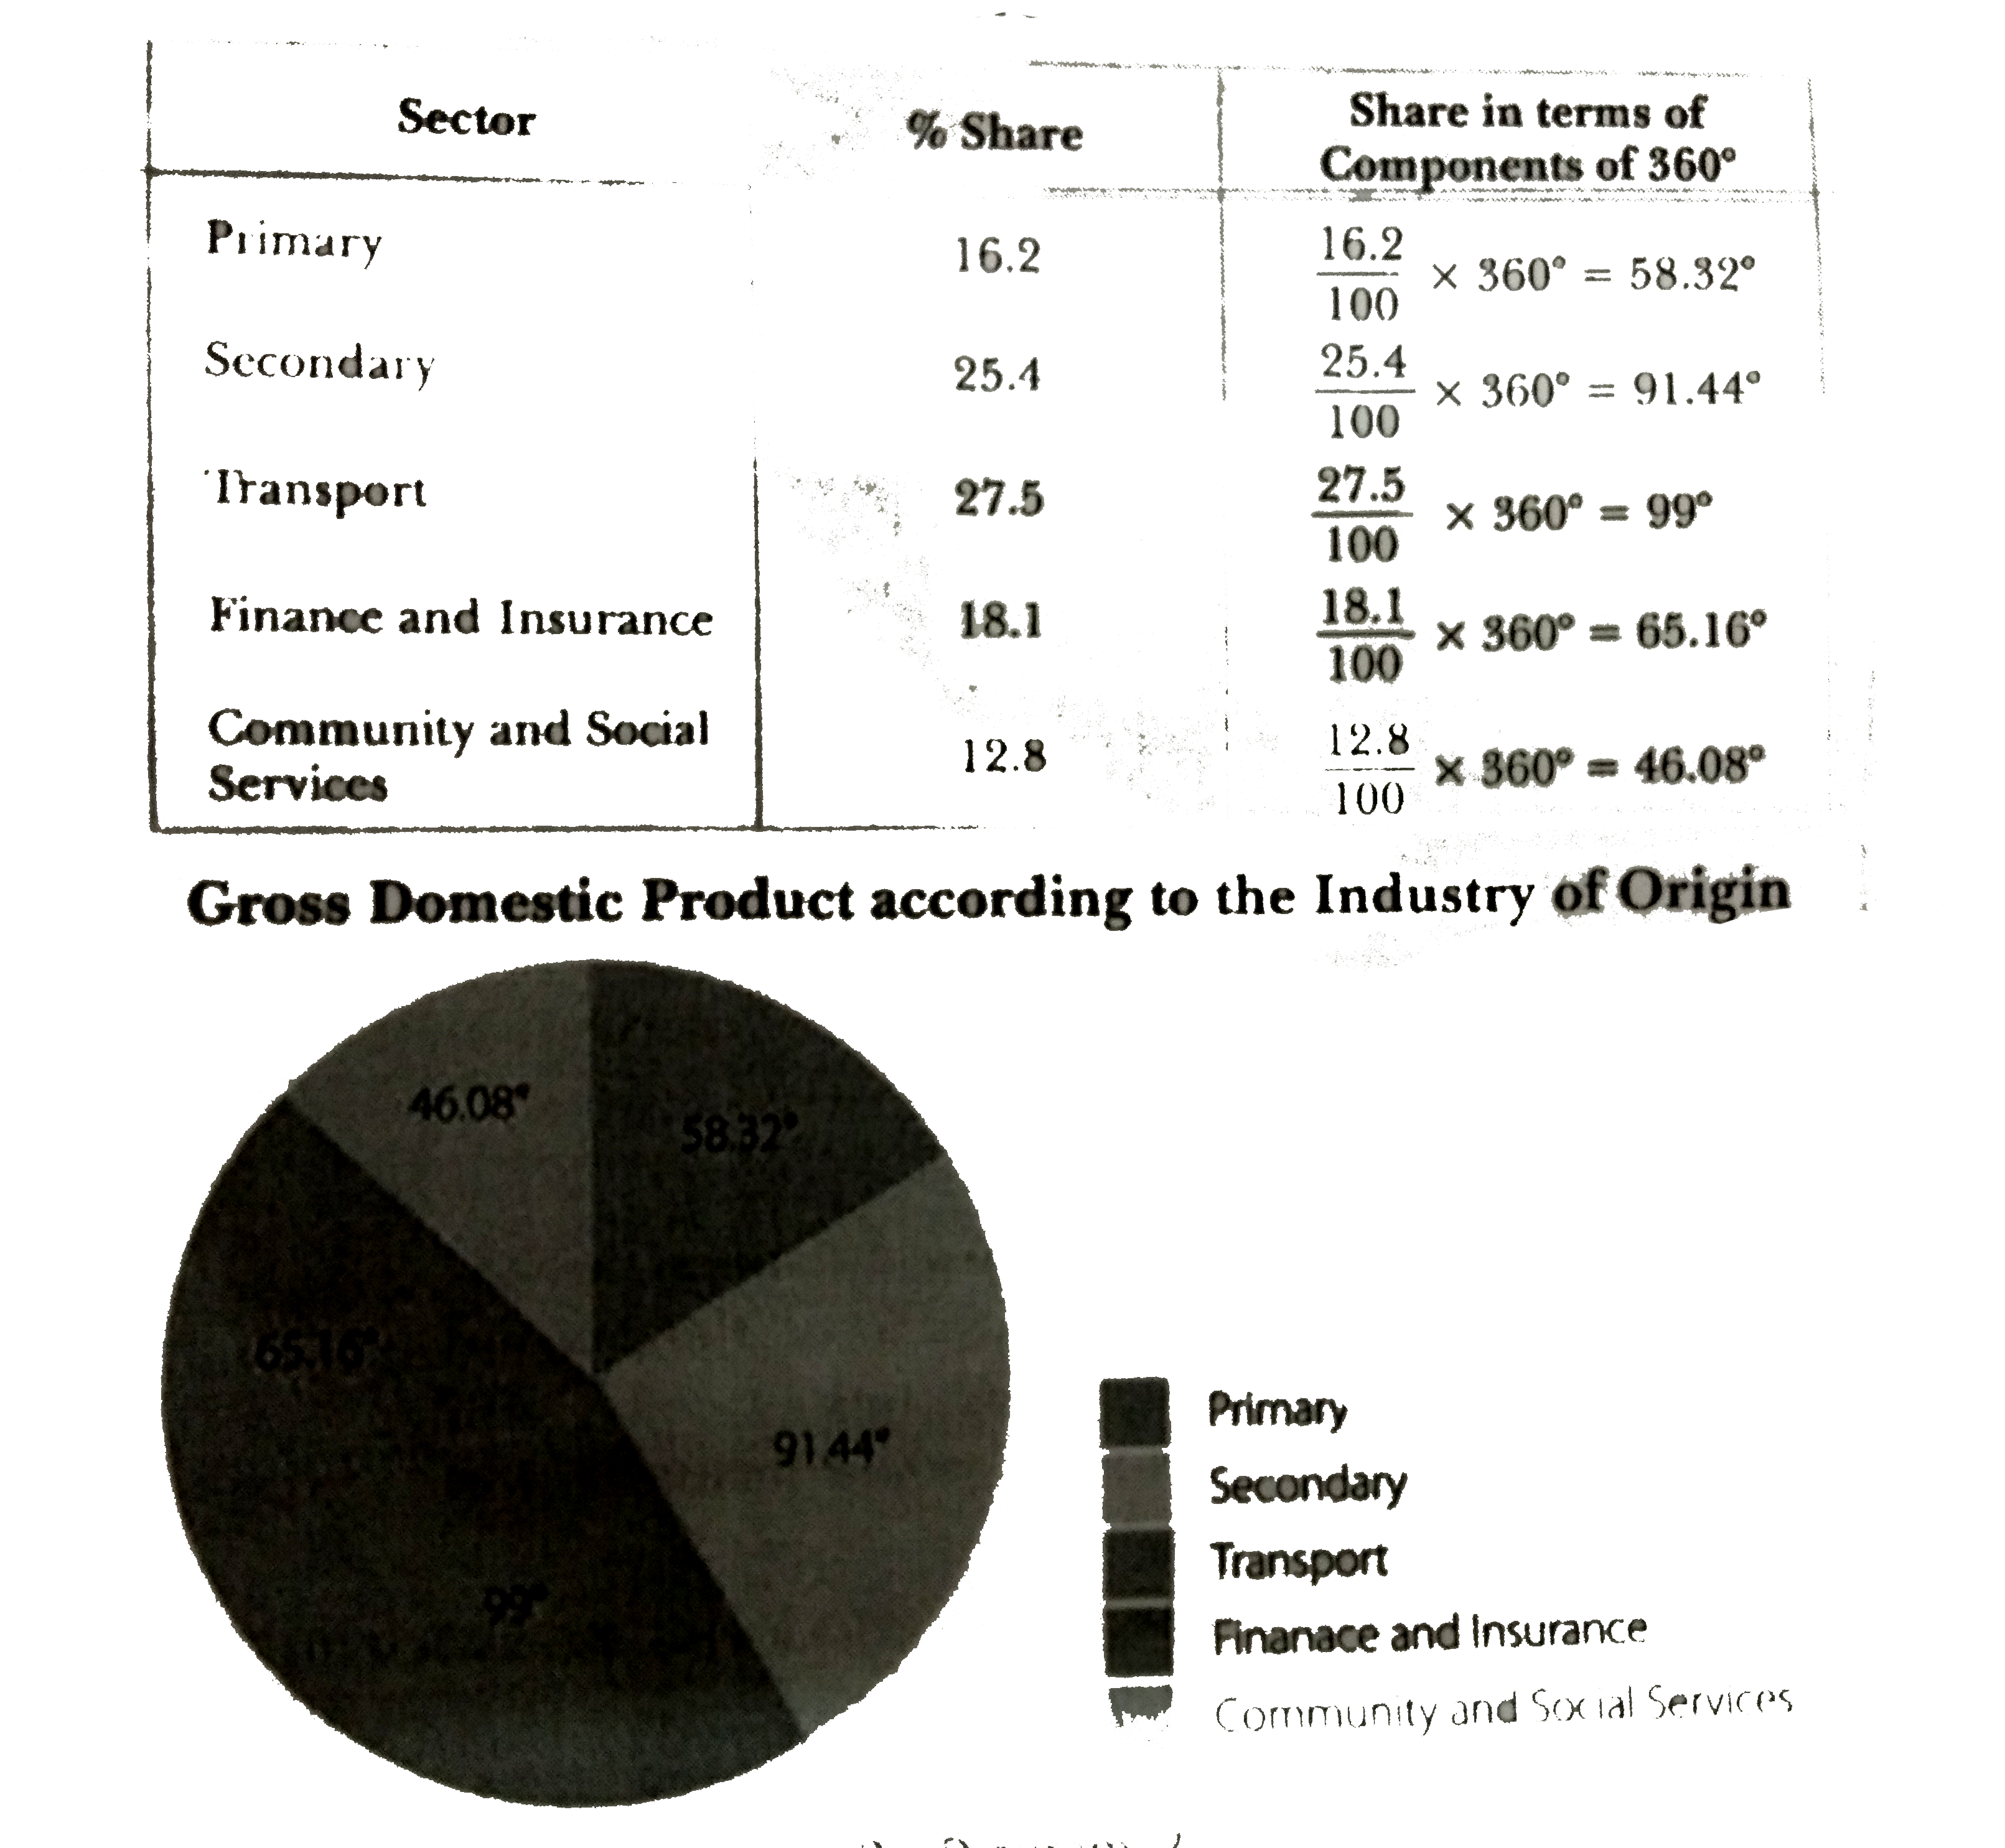
  1. In 2011-12, Net Domestic Pdoduct by Industry of origin (at 2004-05) is...

    Text Solution

    |

  2. जीवात जीवोत्पत्ति से आप क्या समझते है? जीवन की उत्पति के संबंधन में लु...

    Text Solution

    |

  3. जीवन की उत्पत्ति के समय स्वतंत्र अवस्था में नहीं पायी जाती थी-

    Text Solution

    |

  4. 1.5 वोल्ट का एक आदर्श सेल 100 Omega तथा 200 Omega के प्रतिरोधों क...

    Text Solution

    |

  5. दिए गए चित्र में दिखाए गए परिपथ में लगी बैटरी का विधुत वाहक बल्ब 12 बो...

    Text Solution

    |

  6. संलग्न चित्र में, यदि धारामापी G में कोई विक्षेप नहीं हैं तो एक दशा मे...

    Text Solution

    |

  7. किसी धारावाही अल्पांश dl से r दूरी पर चुम्बकीय क्षेत्र के लिए बायो-सैव...

    Text Solution

    |

  8. प्रदत्त चित्र में दो लम्बे समान्तर धारावाही चालकों में 1 ऐम्पियर तथा ...

    Text Solution

    |

  9. दो लम्बे सीधे तार परस्पर 75 सेमी की दूरी पर है। इनमें 5.0 ऐम्पियर की ध...

    Text Solution

    |