Text Solution
Verified by Experts


Similar Questions
Explore conceptually related problems
Recommended Questions
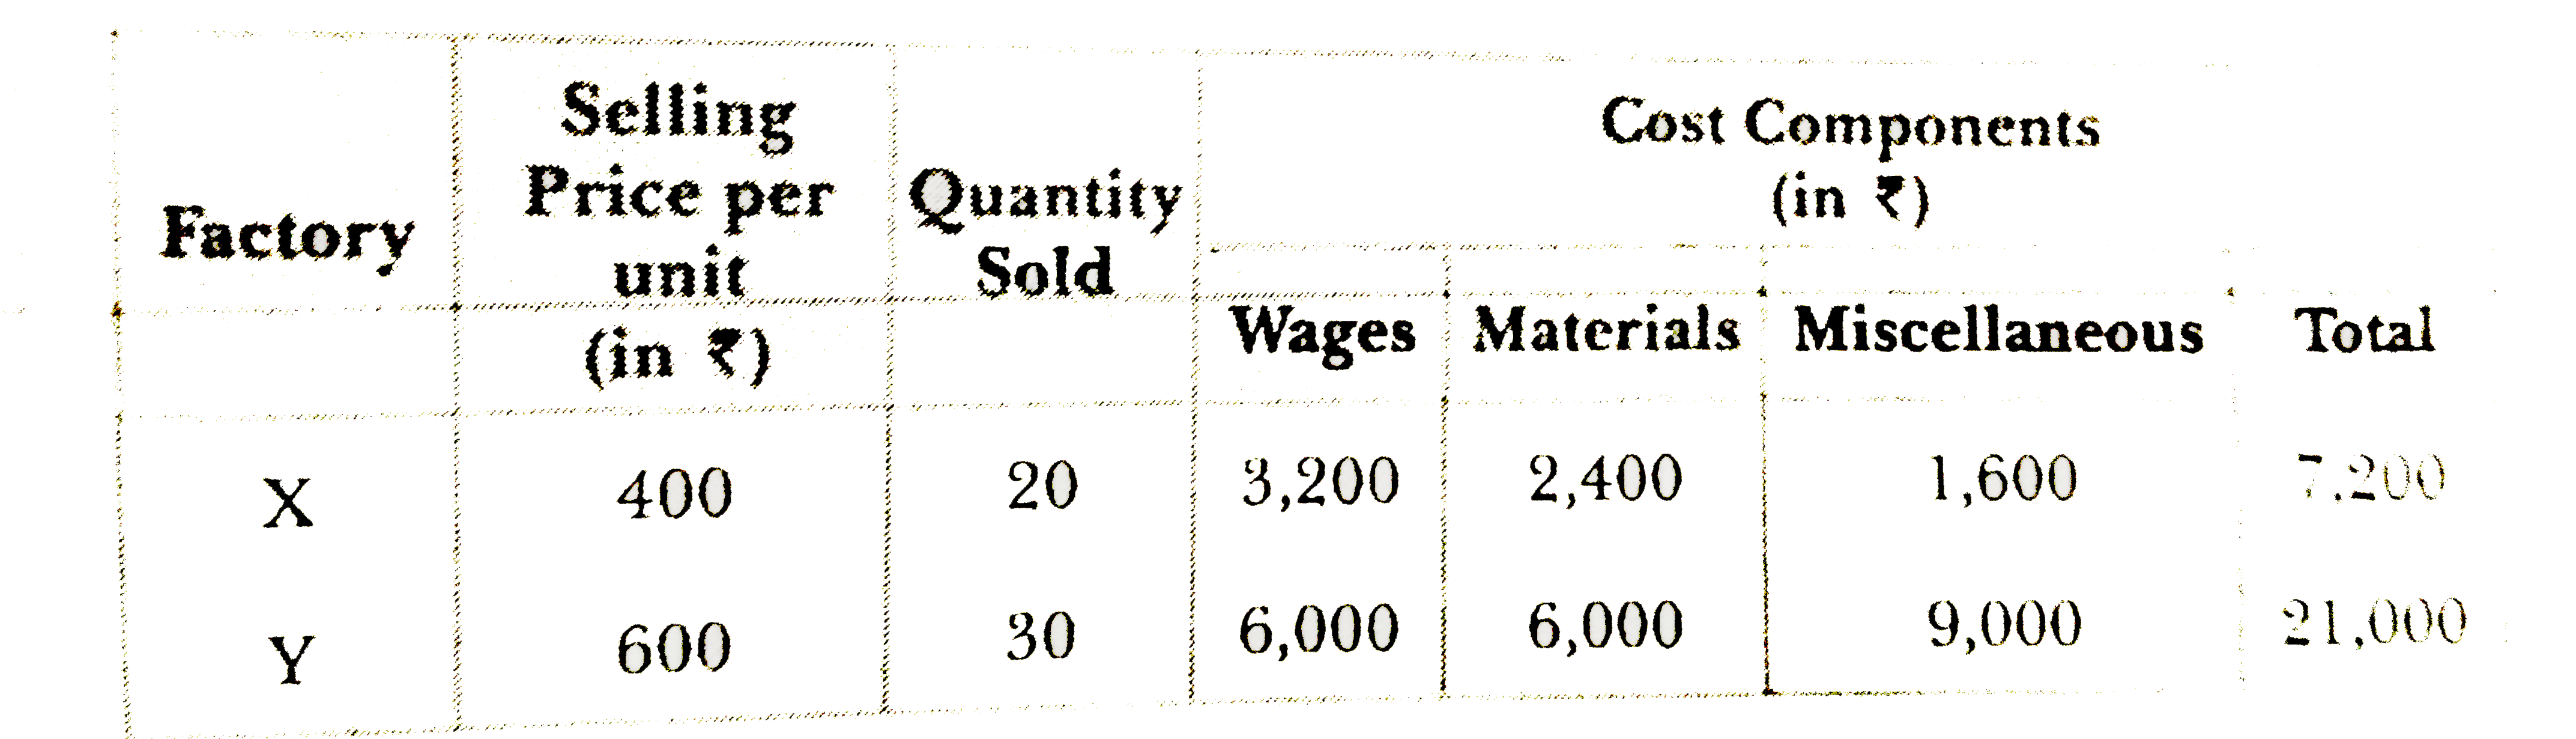
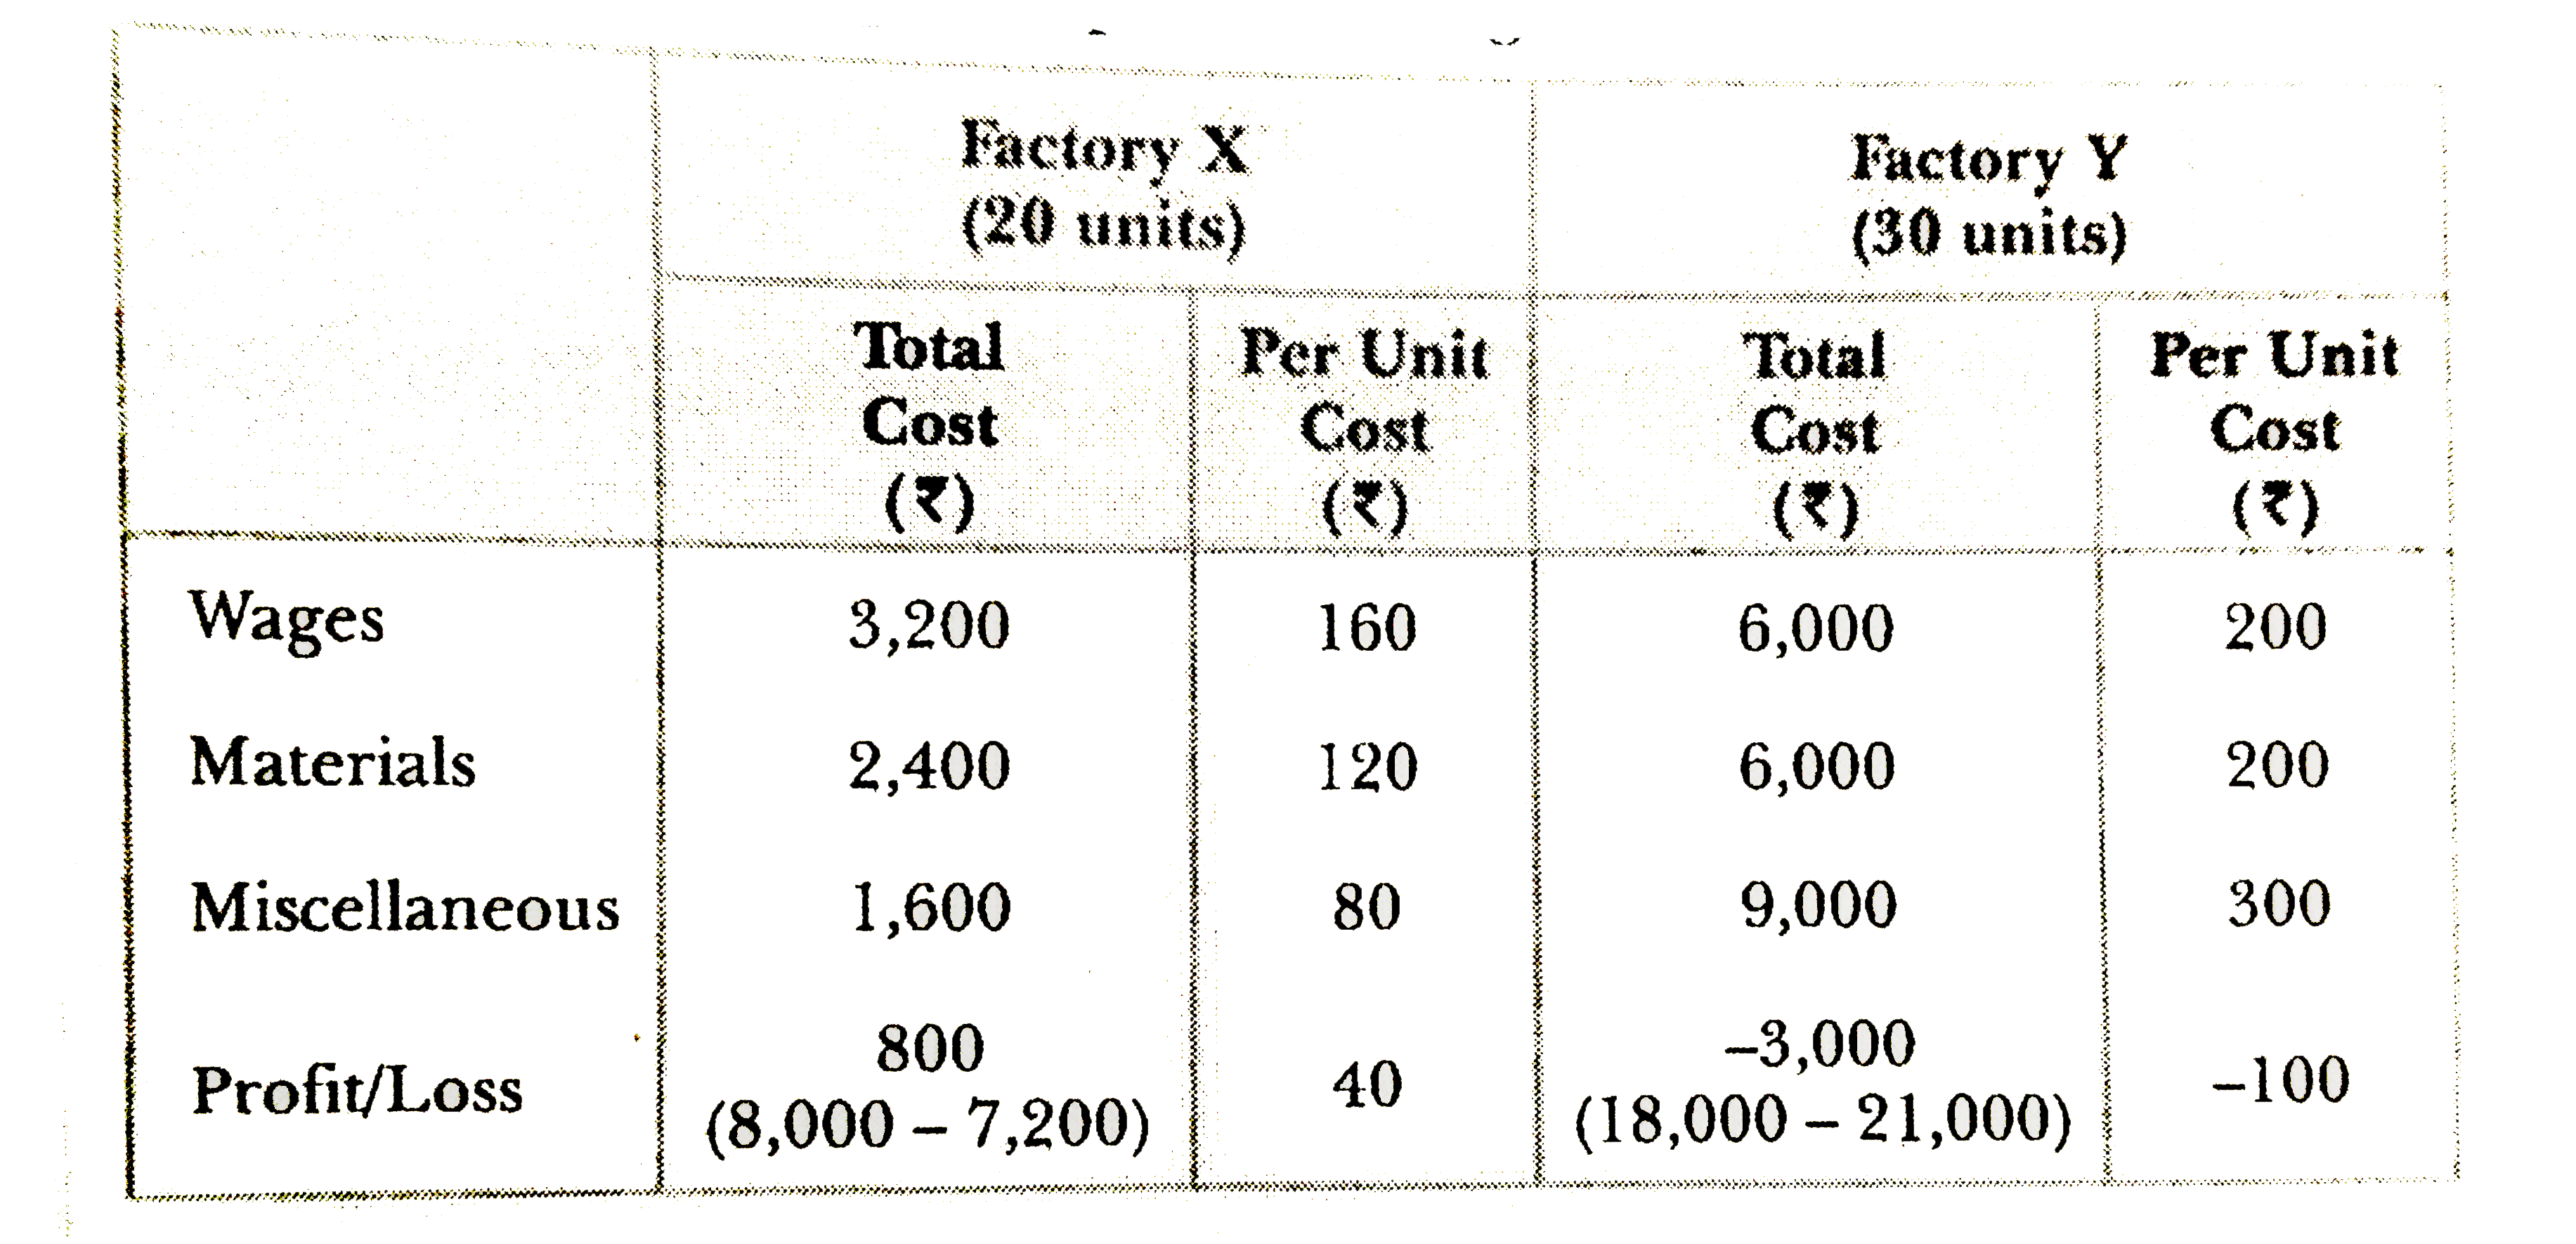
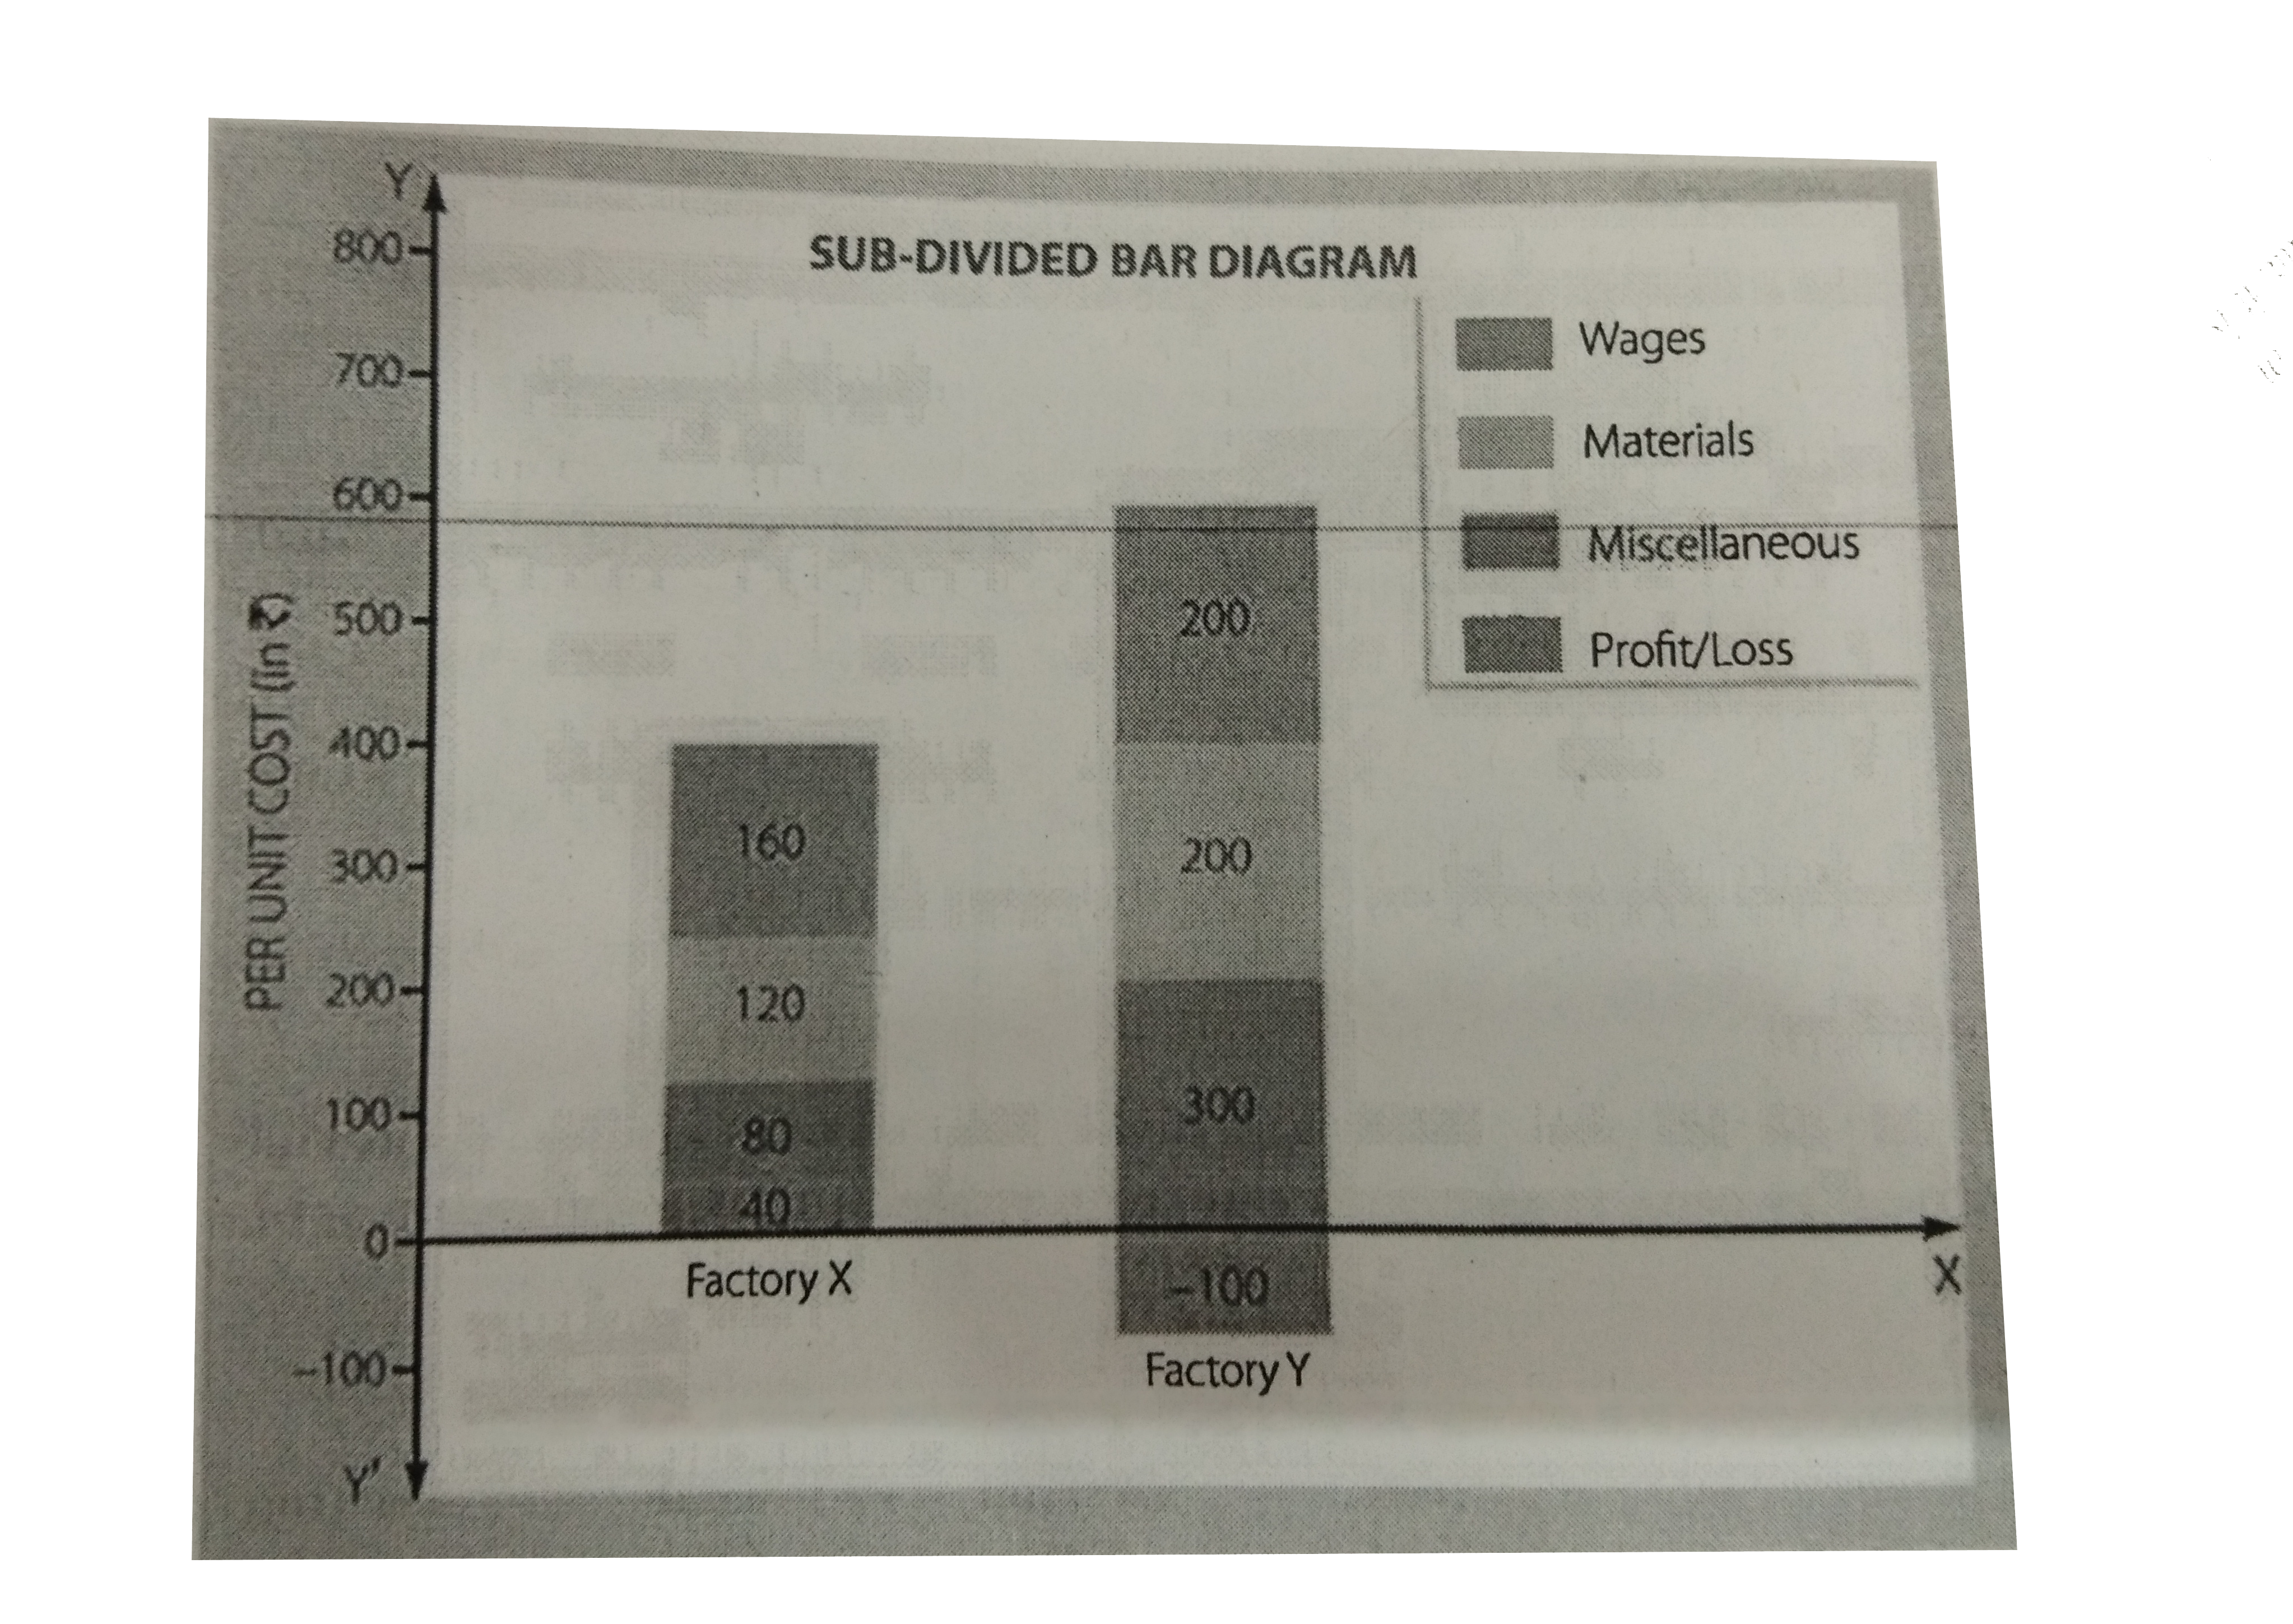
- Draw a suitable diagram to represetn the following information : ...
Text Solution
|
- निम्नलिखित अभिक्रियाओं में योगिक [A] तथा [B] को पहचानिए तथा सम्बंधित...
Text Solution
|
- प्रयोगशाला में क्लोरोफॉर्म बनाने की विधि का नामांकित चित्र सहित वर्णन ...
Text Solution
|
- प्रशीतक के रूप में प्रयोग होने वाला यौगिक है-
Text Solution
|
- 1.5 वोल्ट का एक आदर्श सेल 100 Omega तथा 200 Omega के प्रतिरोधों क...
Text Solution
|
- संलग्न चित्र में, यदि धारामापी G में कोई विक्षेप नहीं हैं तो एक दशा मे...
Text Solution
|
- किसी धारामापी को अमीटर में कैसे परिवर्तित किया जाता है? उपयुक्त परिपथ ...
Text Solution
|
- किसी प्रत्यावर्ती परिपथ में L ,C और R श्रेणीक्रम में जुड़े हैं ...
Text Solution
|
- वाटहीन धारा का एक परिपथ आरेख खीचिए।
Text Solution
|