
Text Solution
Verified by Experts


Similar Questions
Explore conceptually related problems
Recommended Questions
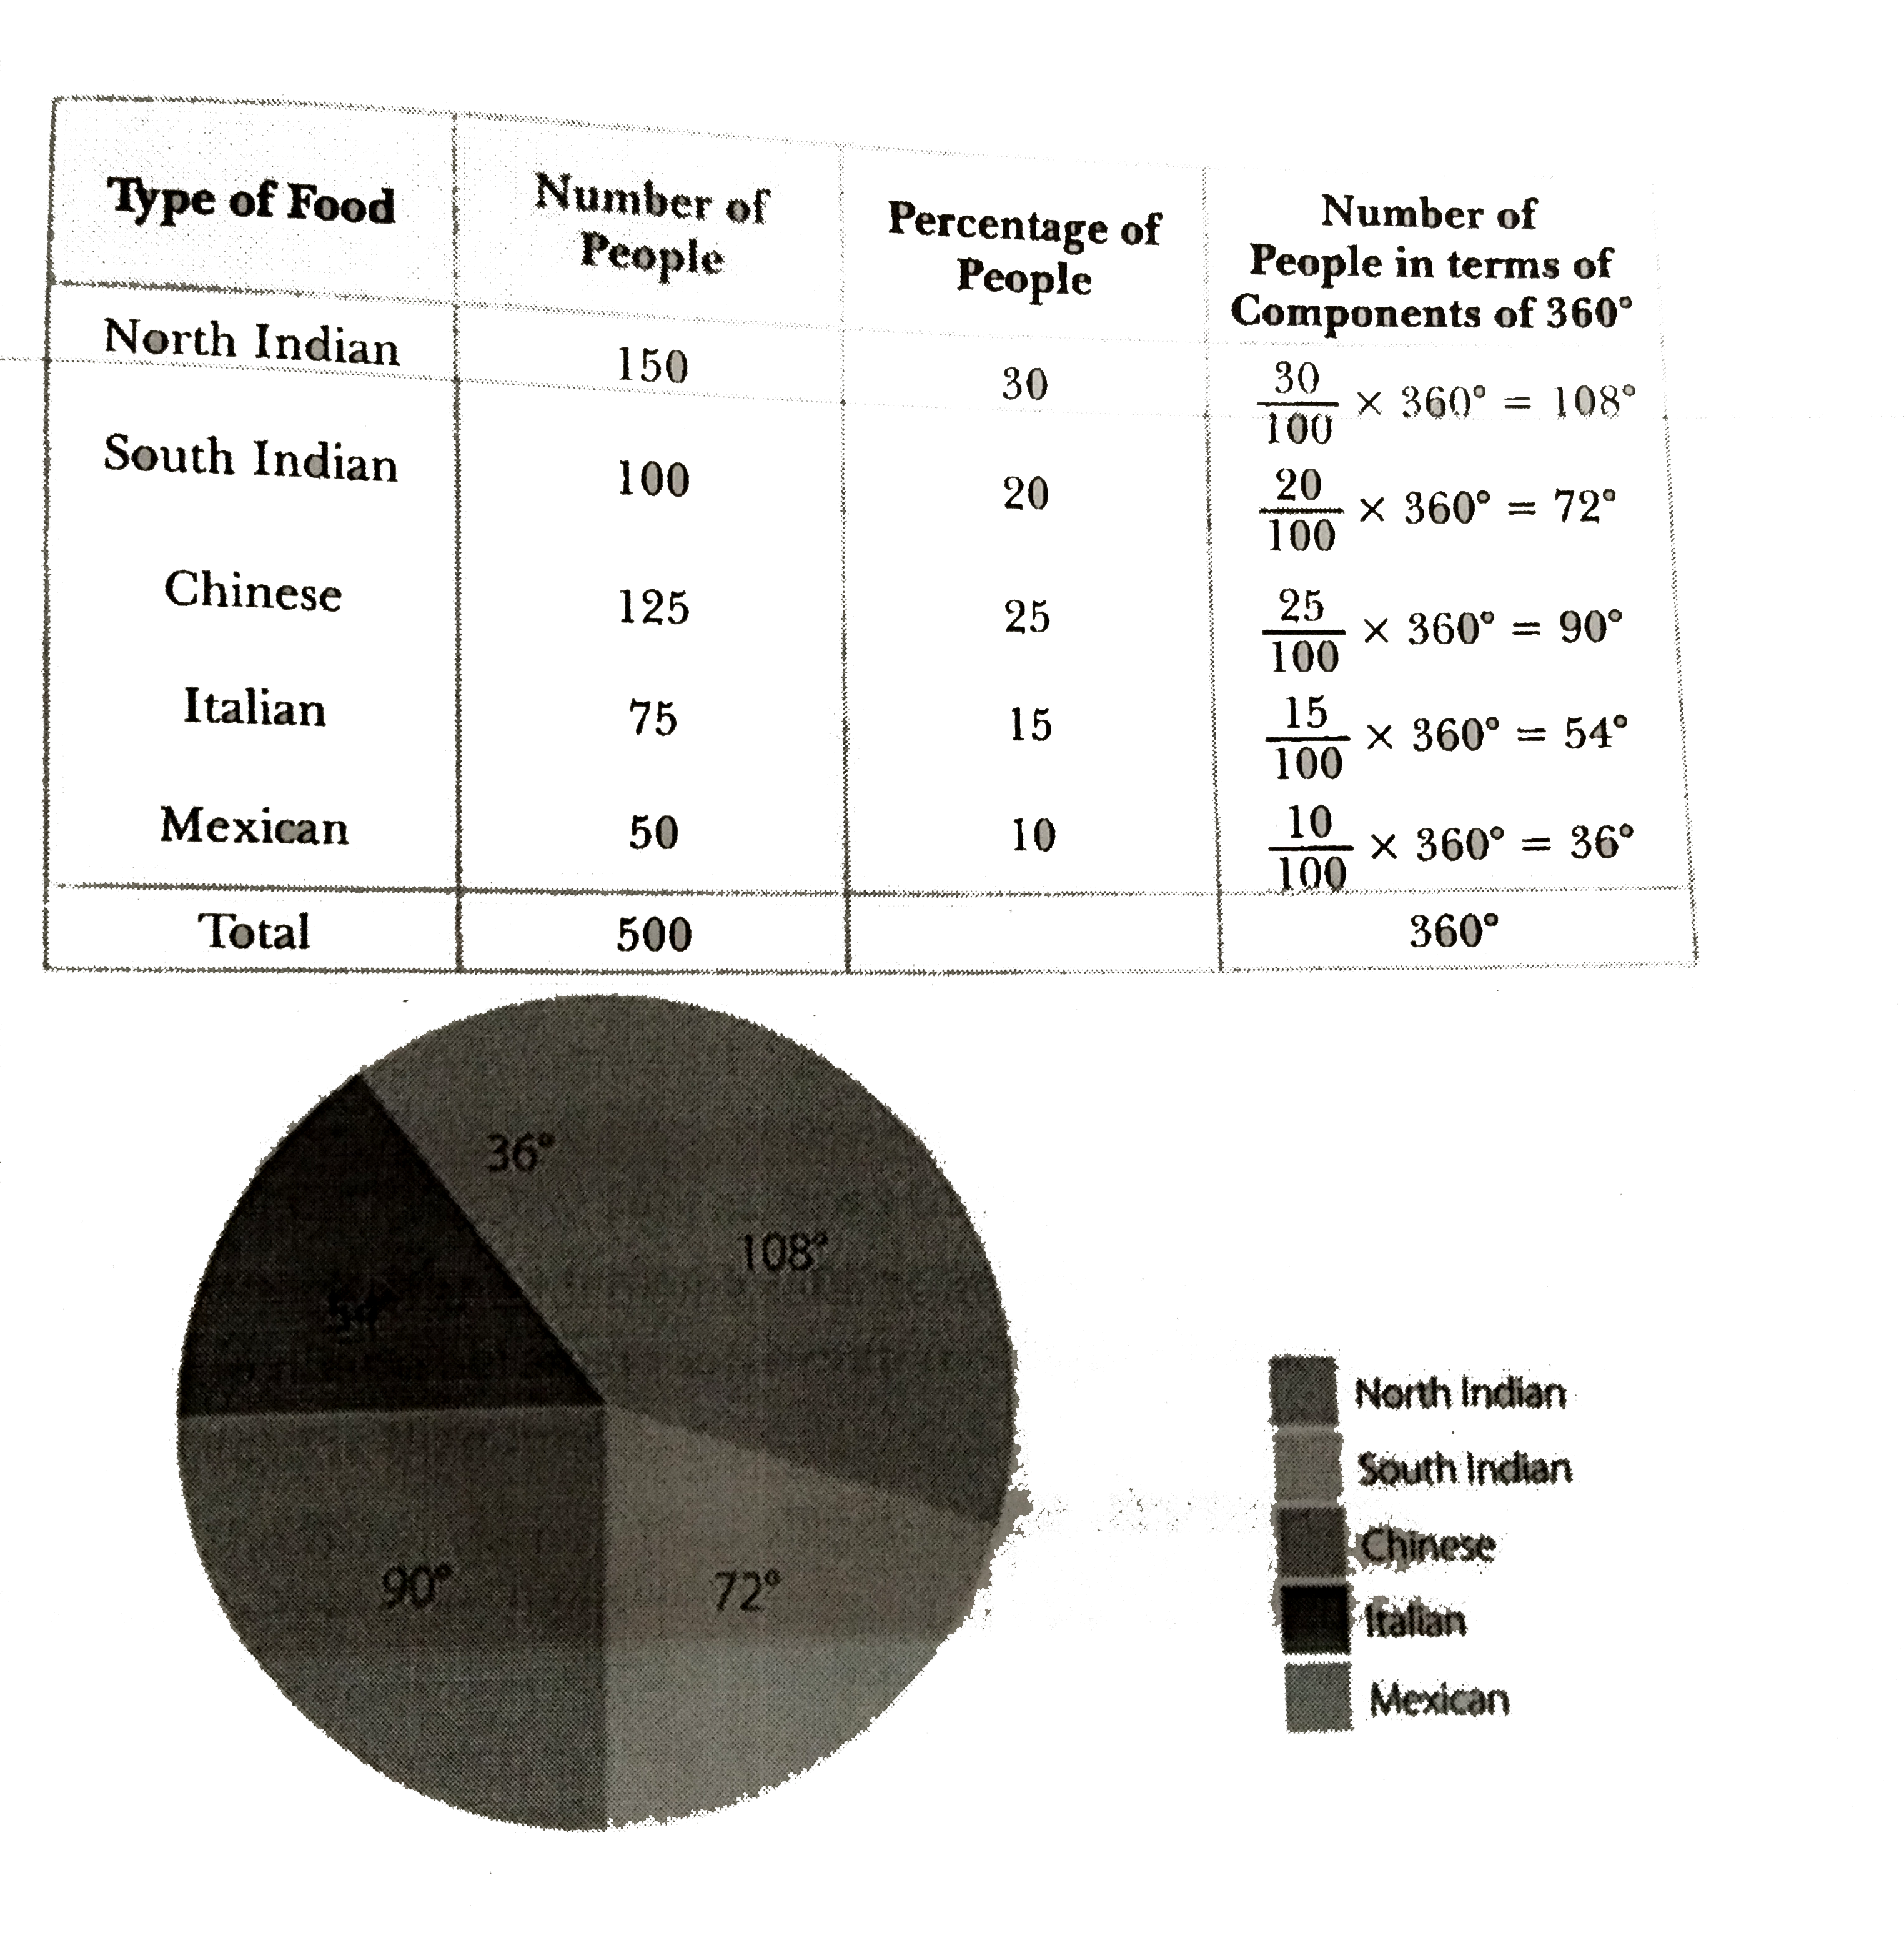
- The tatste of 500 people of a sociaety for different type of food was ...
Text Solution
|
- 1.5 वोल्ट का एक आदर्श सेल 100 Omega तथा 200 Omega के प्रतिरोधों क...
Text Solution
|
- किसी प्रत्यावर्ती परिपथ में L ,C और R श्रेणीक्रम में जुड़े हैं ...
Text Solution
|
- वाटहीन धारा का एक परिपथ आरेख खीचिए।
Text Solution
|
- A .C स्त्रोत की आवृत्ति में परिवर्तन के साथ संधारित्र प्रतिघात ...
Text Solution
|
- 25% और 40% सान्द्रण वाले अम्लों को मिलाकर 30% सान्द्रण का 60 लोटर अम्ल...
Text Solution
|
- समस्याओ में रैखिक समीकरणो के युग्म बनाइए और अनके हल ( यदि उनक...
Text Solution
|
- k के किस मान के लिये , निम्नलिखित समीकरण निकाय समपाती रेखाओ को प्...
Text Solution
|
- p-प्रकार का अर्ध्दचालक प्राप्त करने के लिए सिलिकॉन को निम्नलिखित किस त...
Text Solution
|