


Topper's Solved these Questions
DIAGRAMMATIC PRESENTATION OF DATA BAR DIAGRAMS AND PIE DIAGRAMS
TARUN JAIN & VK OHRI|Exercise NCERT Question (With Hints to Answers)|3 VideosDIAGRAMMATIC PRESENTATION OF DATA BAR DIAGRAMS AND PIE DIAGRAMS
TARUN JAIN & VK OHRI|Exercise Essential praticals|1 VideosCORRELATION
TARUN JAIN & VK OHRI|Exercise NCERT Questions (with Hints to Answers)|10 VideosFREQUENCY DIAGRAMS - HISTOGRAM, POLYGON AND OGIVE
TARUN JAIN & VK OHRI|Exercise EXERCISE NCERT|7 Videos
Similar Questions
Explore conceptually related problems
TARUN JAIN & VK OHRI-DIAGRAMMATIC PRESENTATION OF DATA BAR DIAGRAMS AND PIE DIAGRAMS-Long Answer Type Question
- Give a diagrammatic presentation of the following data on india's Expo...
Text Solution
|
- Make a bar diagram of the following data on india's population:
Text Solution
|
- Make a multiple bar diagram of the following data
Text Solution
|
- Following tables shows estimates of cost of production of certain comm...
Text Solution
|
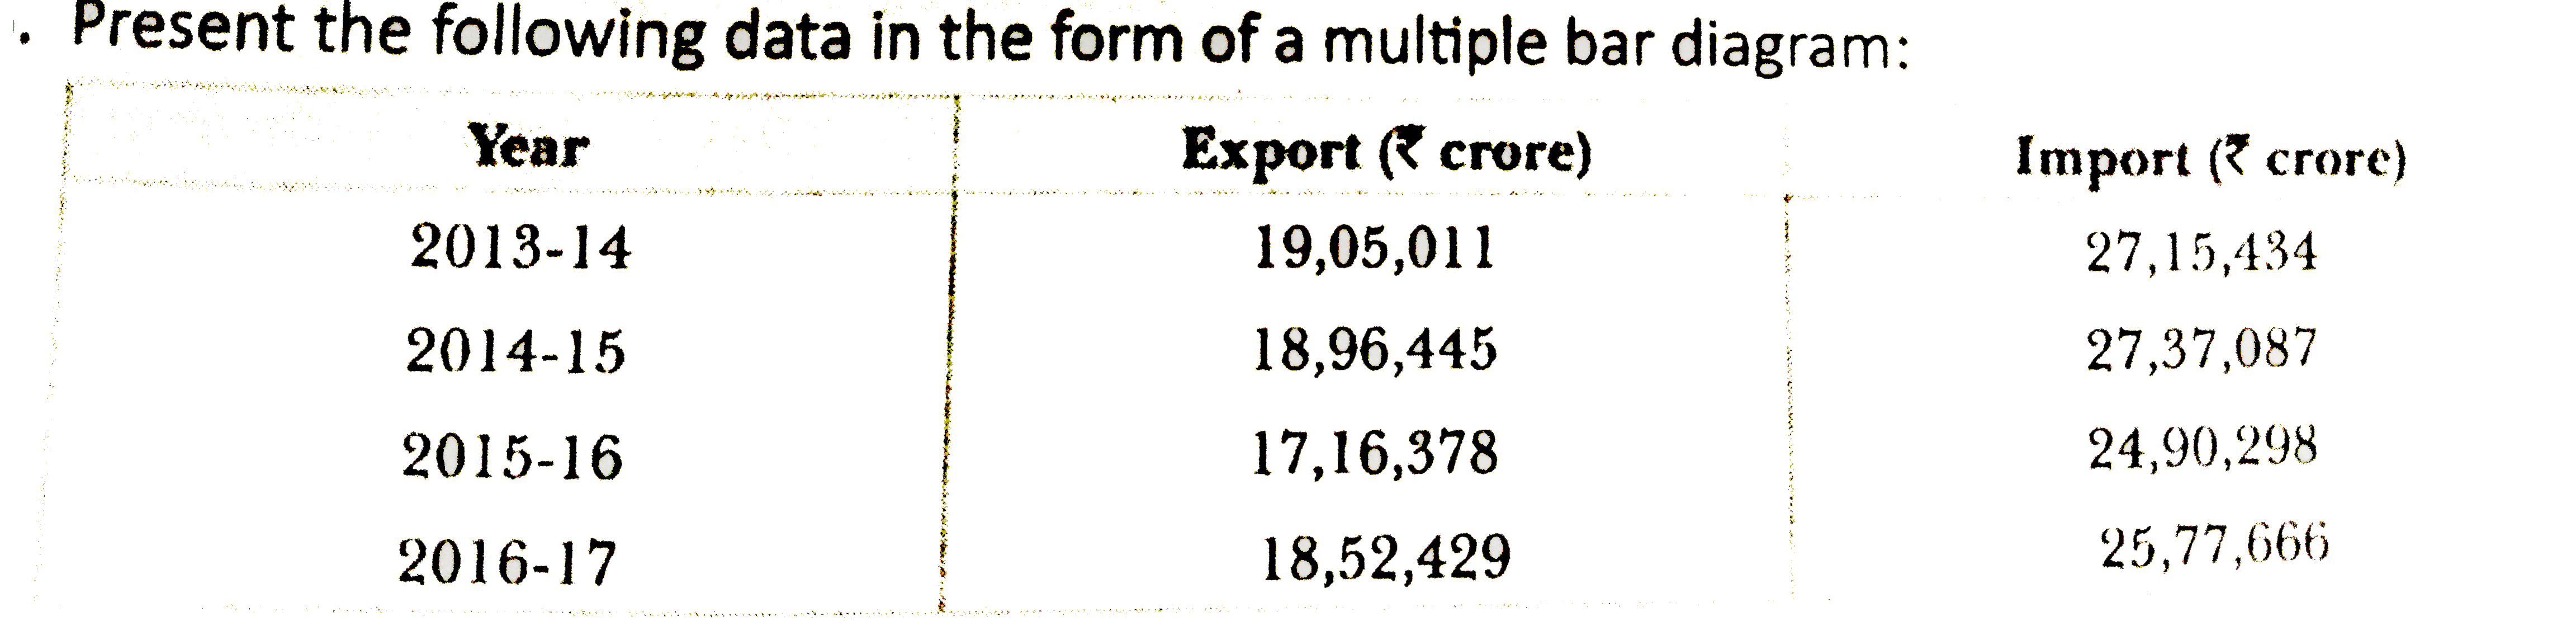
- Present the following data in the form of a multiple bar diagrm:
Text Solution
|
- What do you mean by a circualr diagram? Present the dat on the expendi...
Text Solution
|
- Following data relate to the construction of a house in delhi .presen...
Text Solution
|
- For the year 2012-13 and 2013-14 value of gross domestic product at fa...
Text Solution
|
- Present the following data on the production of food grains in the fo...
Text Solution
|
- Present the following data by a devidation bar diagram showning the di...
Text Solution
|