Text Solution
Verified by Experts


Topper's Solved these Questions
FREQUENCY DIAGRAMS - HISTOGRAM, POLYGON AND OGIVE
TARUN JAIN & VK OHRI|Exercise Miscellaneous Illustration|8 VideosFREQUENCY DIAGRAMS - HISTOGRAM, POLYGON AND OGIVE
TARUN JAIN & VK OHRI|Exercise EXERCISE M.C.Q|6 VideosDIAGRAMMATIC PRESENTATION OF DATA BAR DIAGRAMS AND PIE DIAGRAMS
TARUN JAIN & VK OHRI|Exercise NCERT Question (With Hints to Answers)|3 VideosINDEX NUMBERS
TARUN JAIN & VK OHRI|Exercise NCERT Questions (With Hints to Answers)|12 Videos
Similar Questions
Explore conceptually related problems
TARUN JAIN & VK OHRI-FREQUENCY DIAGRAMS - HISTOGRAM, POLYGON AND OGIVE-EXERCISE NCERT
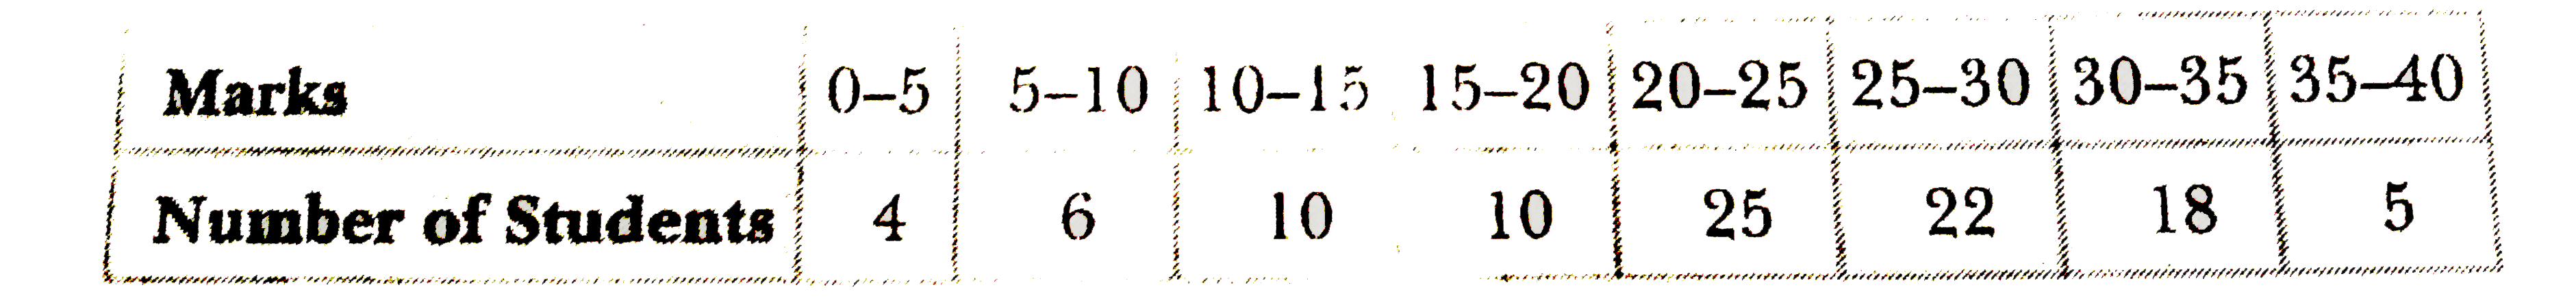
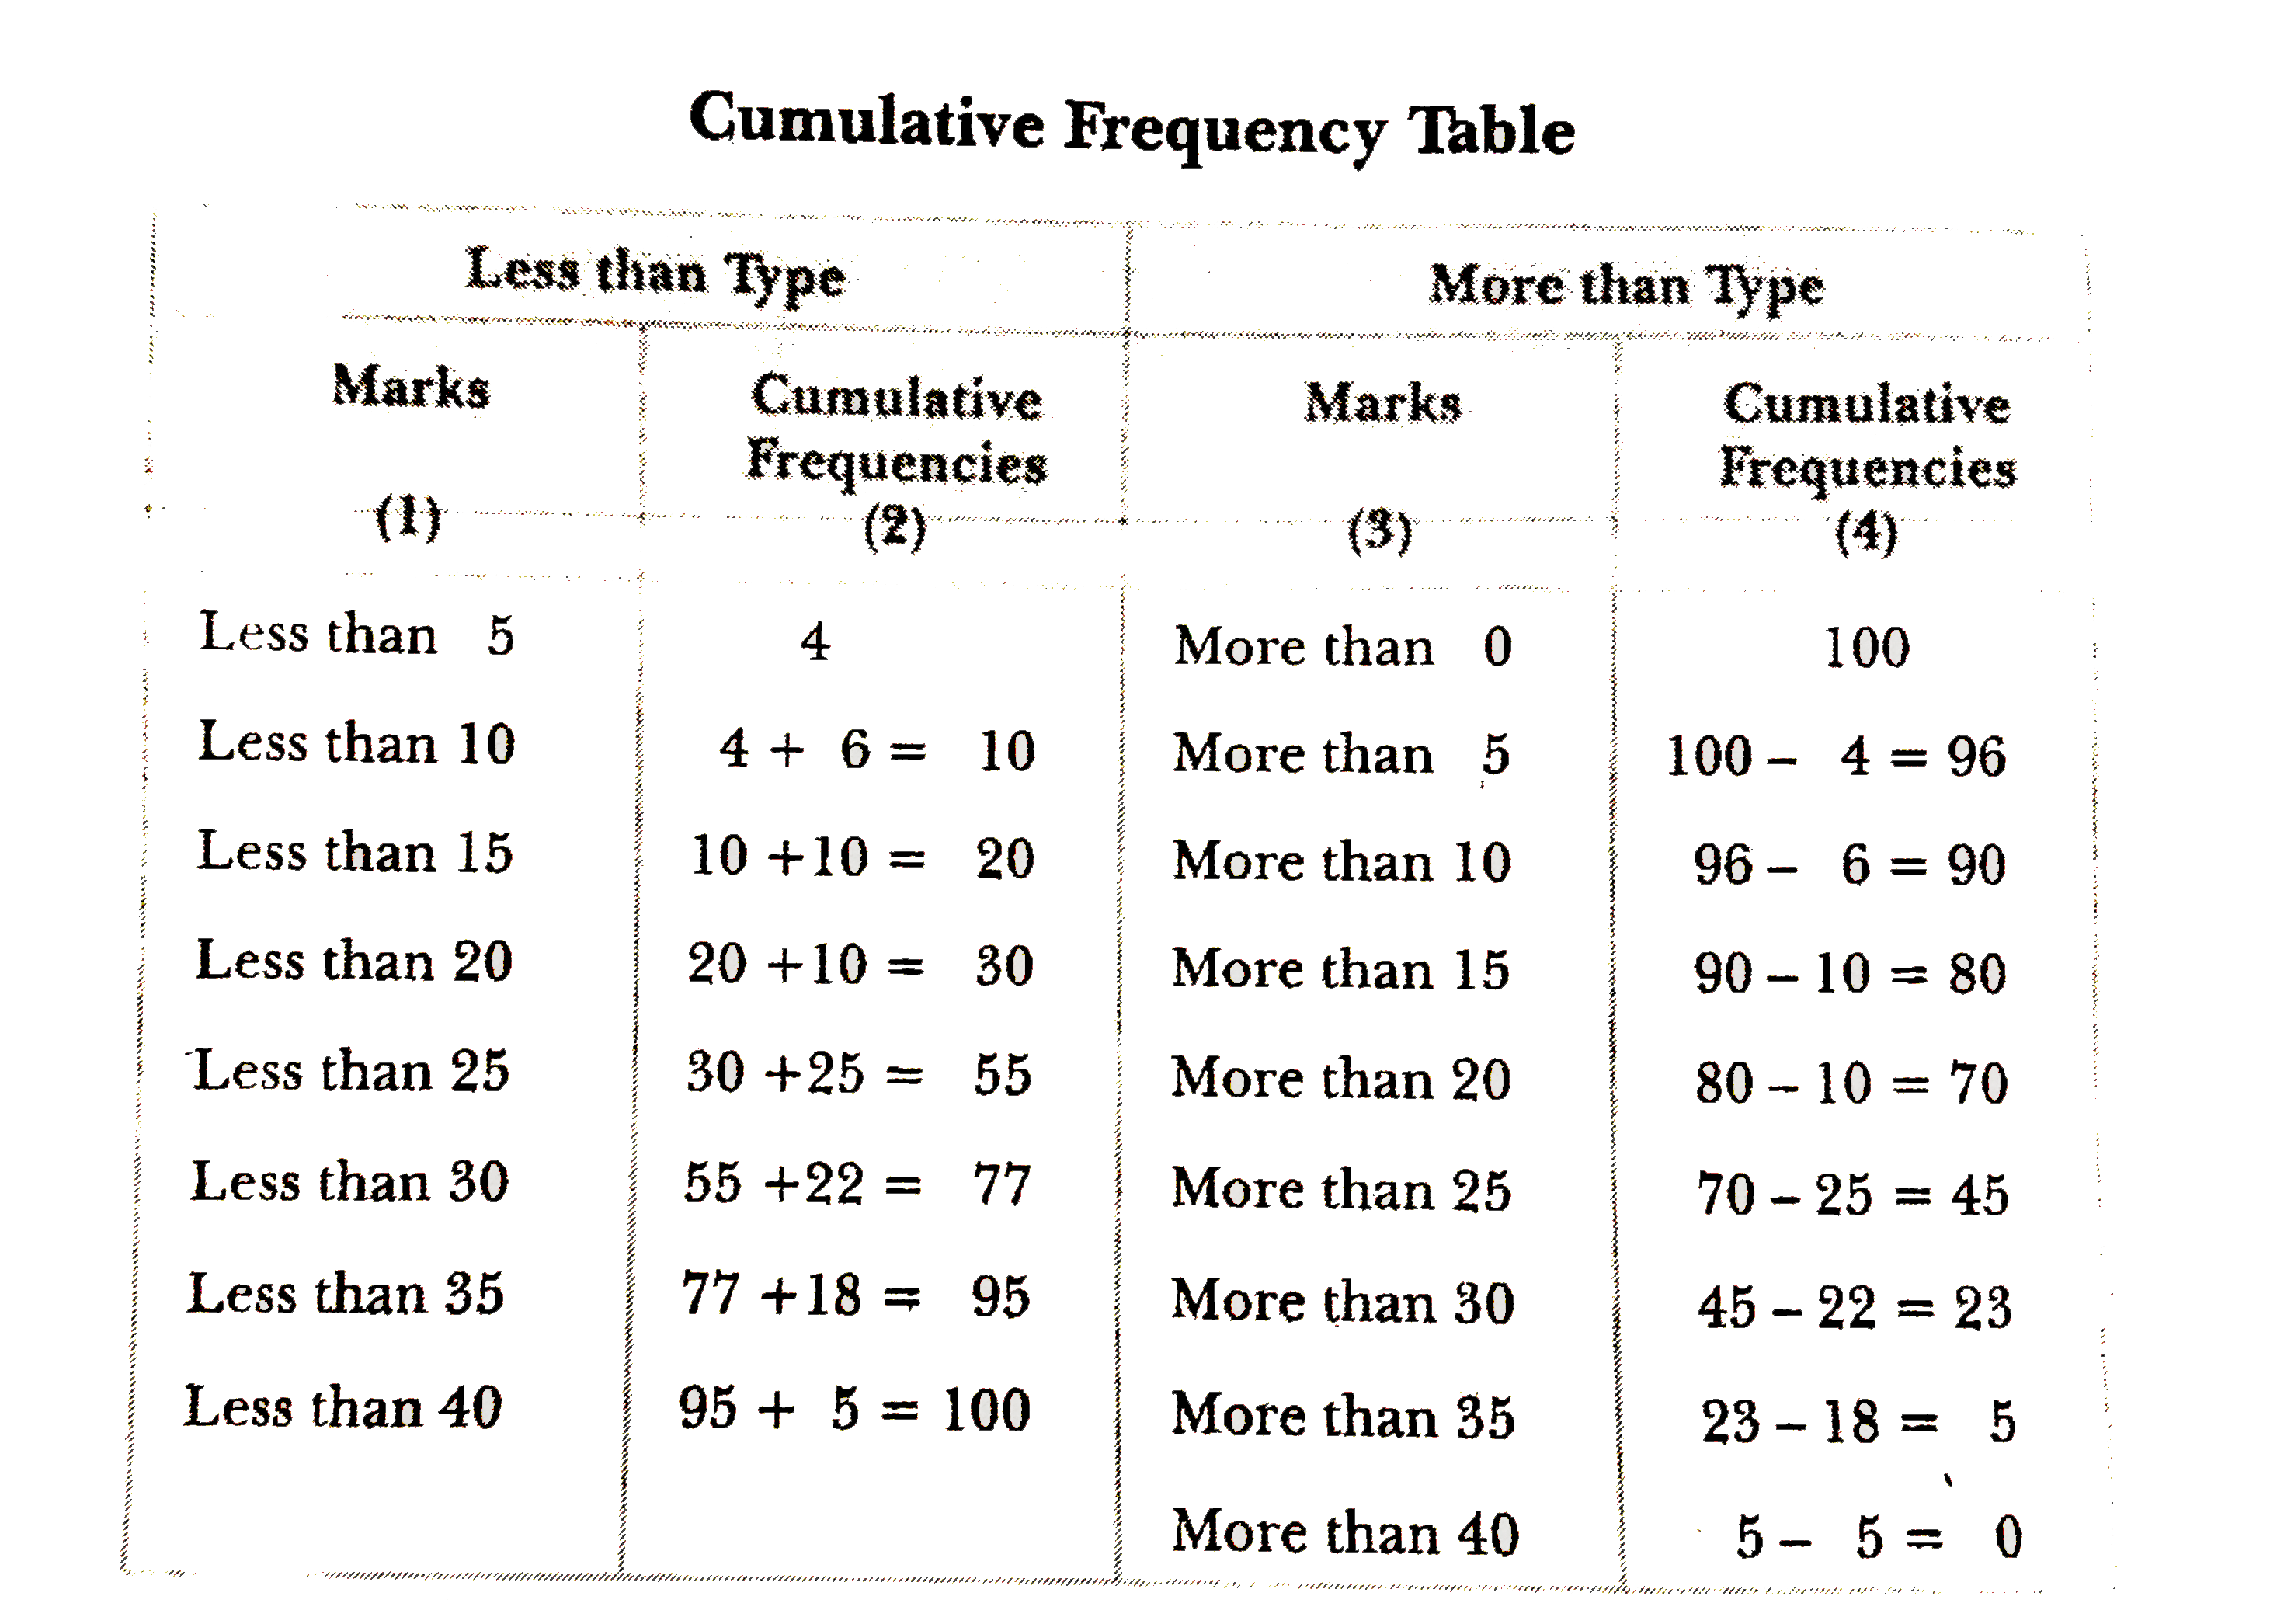
- Following data relate to the marks secured by students in their Statis...
Text Solution
|
- Data represented through a histogram can help in finding graphically t...
Text Solution
|
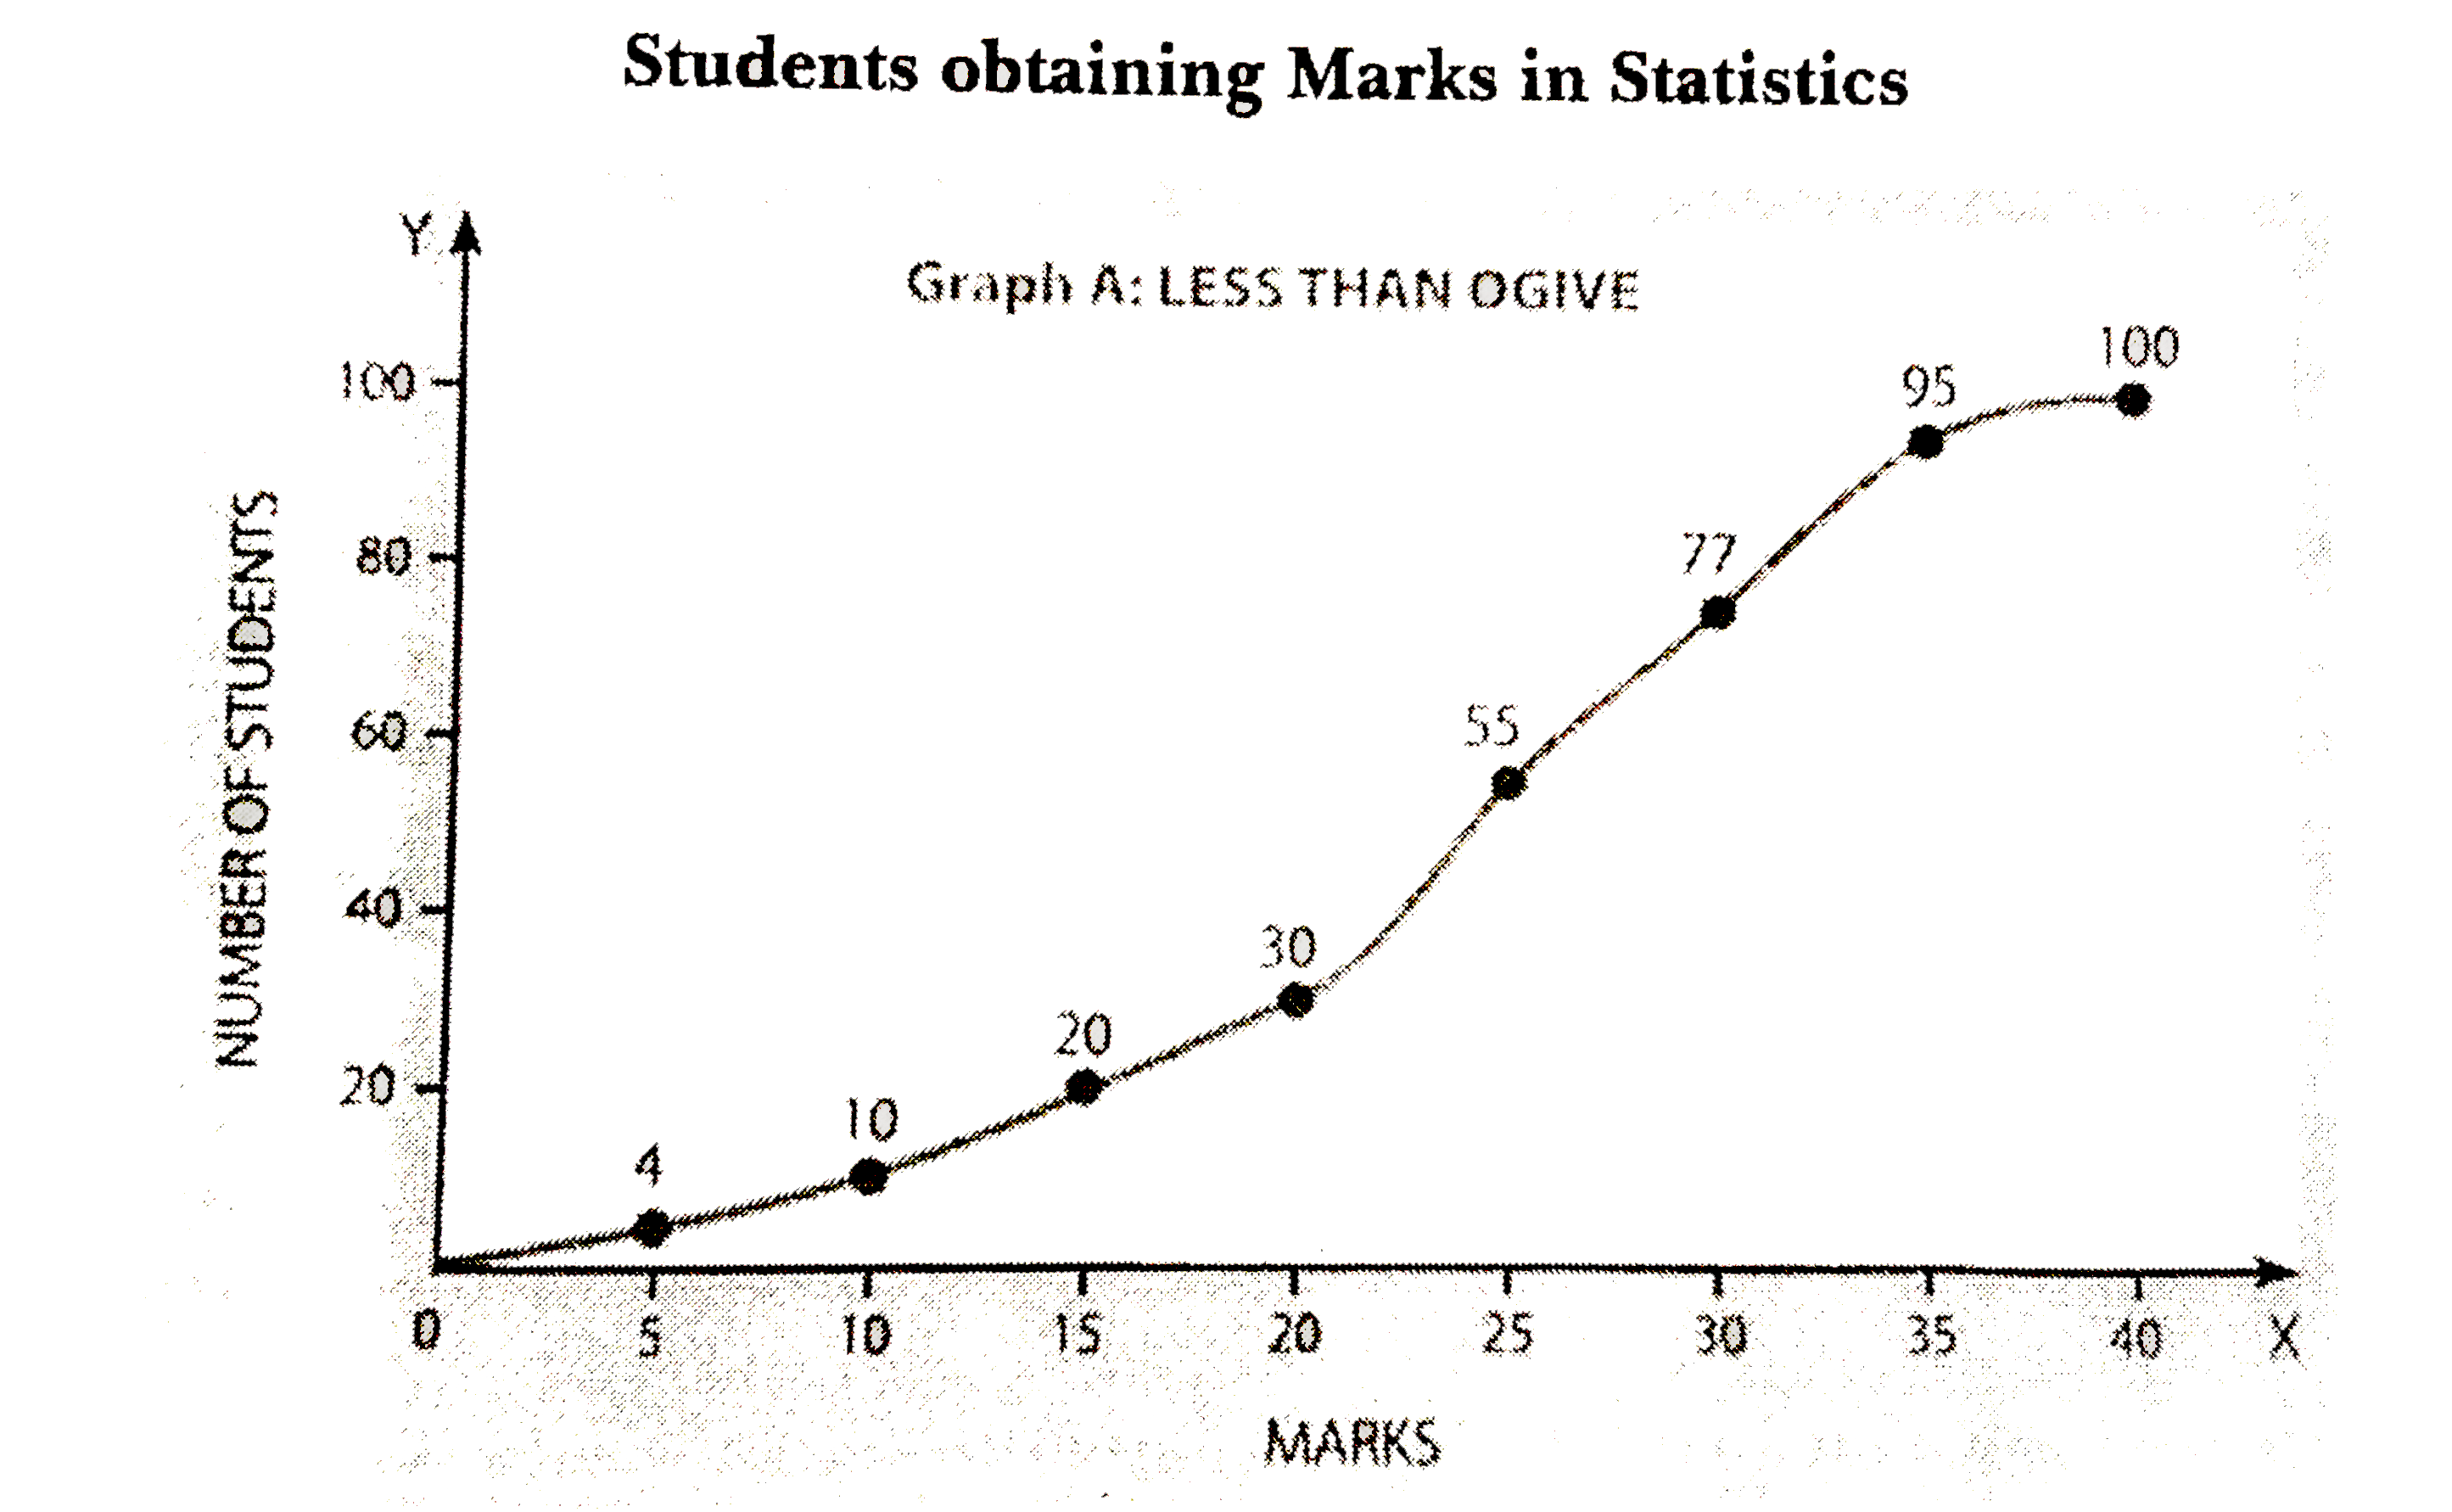
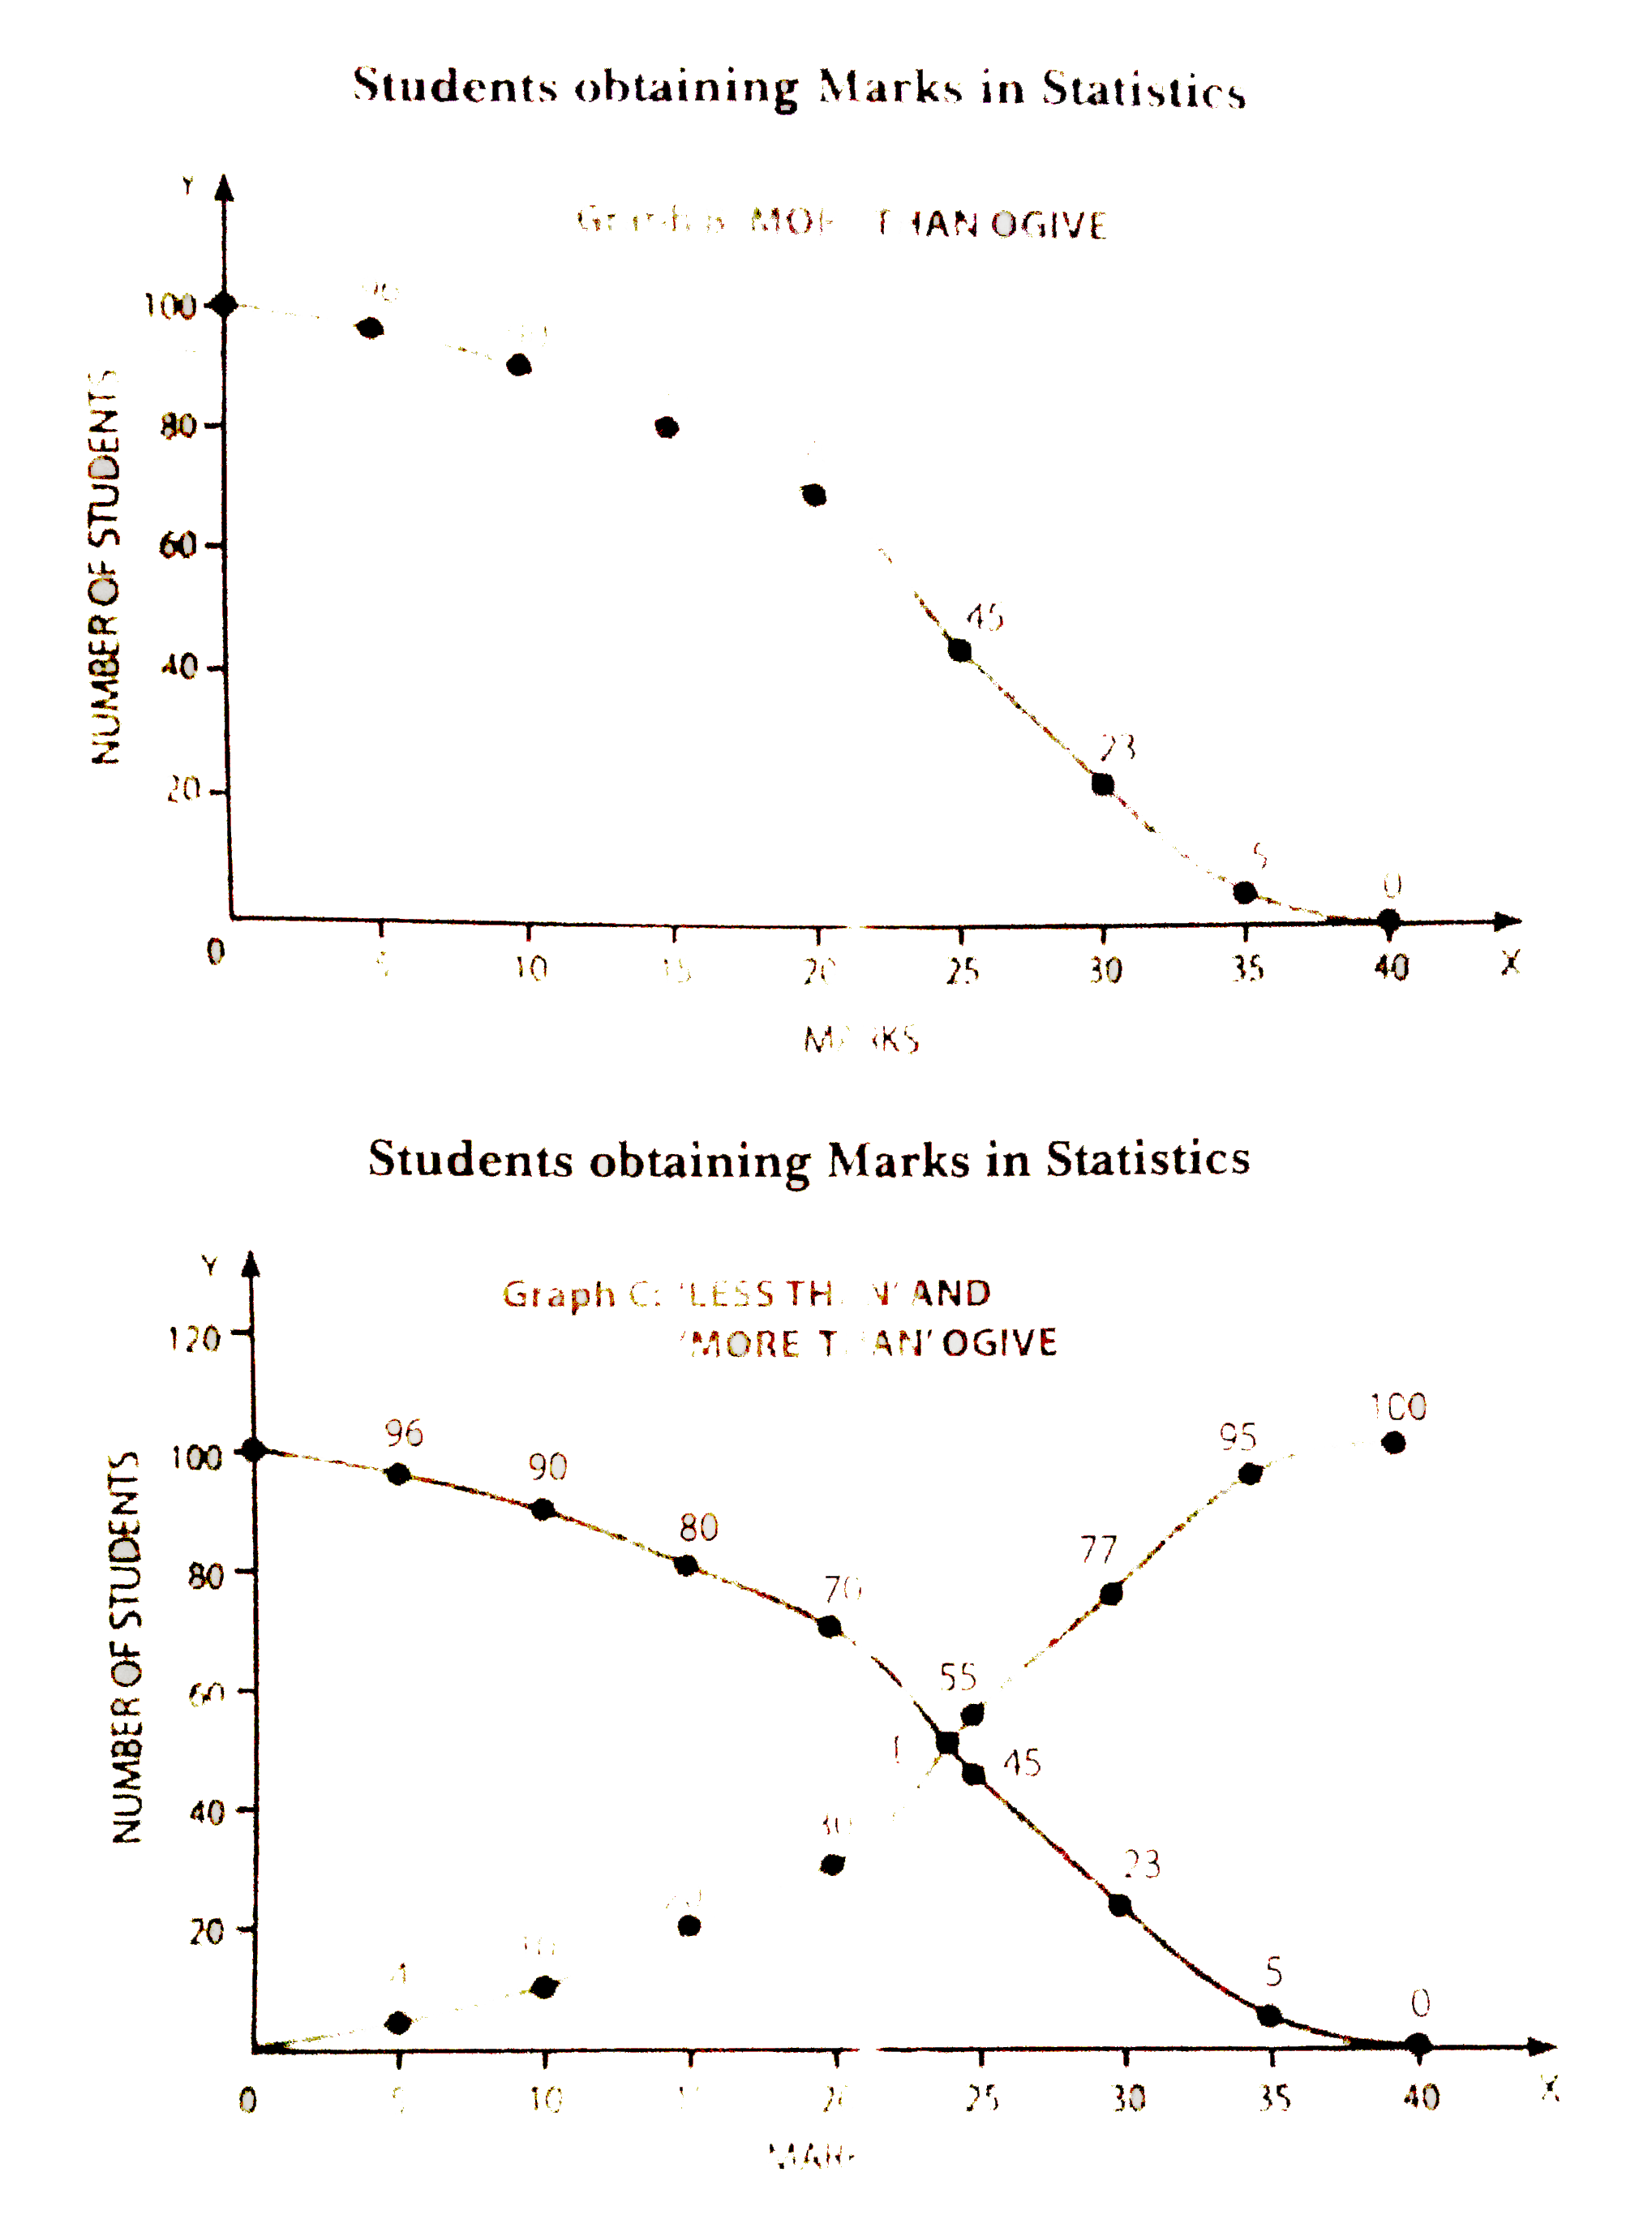
- Ogives can be helpful in locating graphically the :
Text Solution
|
- Width of rectangles in a histogram should essentially be equal. (true ...
Text Solution
|
- Histogram can only be formed with continuous classification of data. (...
Text Solution
|
- Histogram and column diagram are the same method of presentation of da...
Text Solution
|
- Mode of a frequency distribution can be known graphically with the hel...
Text Solution
|
- Median of a frequency distribution cannot be known from the ogives. (t...
Text Solution
|