Text Solution
Verified by Experts


Topper's Solved these Questions
FREQUENCY DIAGRAMS - HISTOGRAM, POLYGON AND OGIVE
TARUN JAIN & VK OHRI|Exercise EXERCISE M.C.Q|6 VideosFREQUENCY DIAGRAMS - HISTOGRAM, POLYGON AND OGIVE
TARUN JAIN & VK OHRI|Exercise EXERCISE FILL IN THE BLANK|5 VideosFREQUENCY DIAGRAMS - HISTOGRAM, POLYGON AND OGIVE
TARUN JAIN & VK OHRI|Exercise EXERCISE NCERT|7 VideosDIAGRAMMATIC PRESENTATION OF DATA BAR DIAGRAMS AND PIE DIAGRAMS
TARUN JAIN & VK OHRI|Exercise NCERT Question (With Hints to Answers)|3 VideosINDEX NUMBERS
TARUN JAIN & VK OHRI|Exercise NCERT Questions (With Hints to Answers)|12 Videos
Similar Questions
Explore conceptually related problems
TARUN JAIN & VK OHRI-FREQUENCY DIAGRAMS - HISTOGRAM, POLYGON AND OGIVE-Miscellaneous Illustration
- Prepare histogram and frequency polygon from the following data :
Text Solution
|
- From the following data, construct frequency histogram, frequency poly...
Text Solution
|
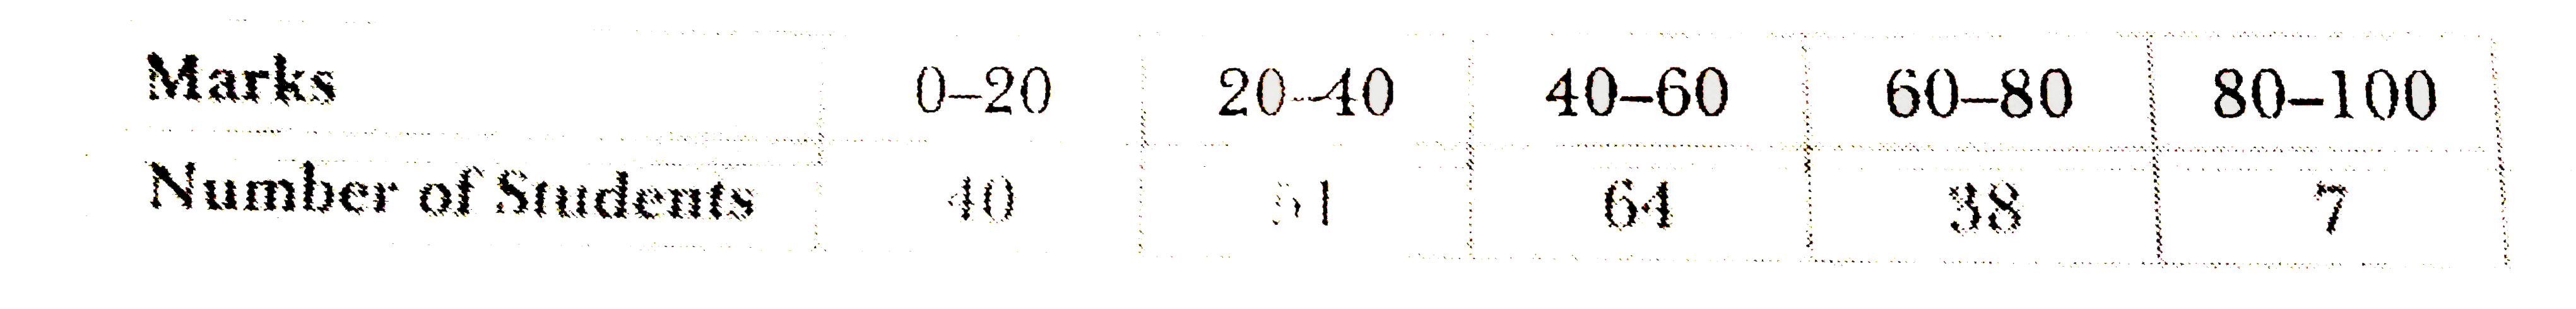
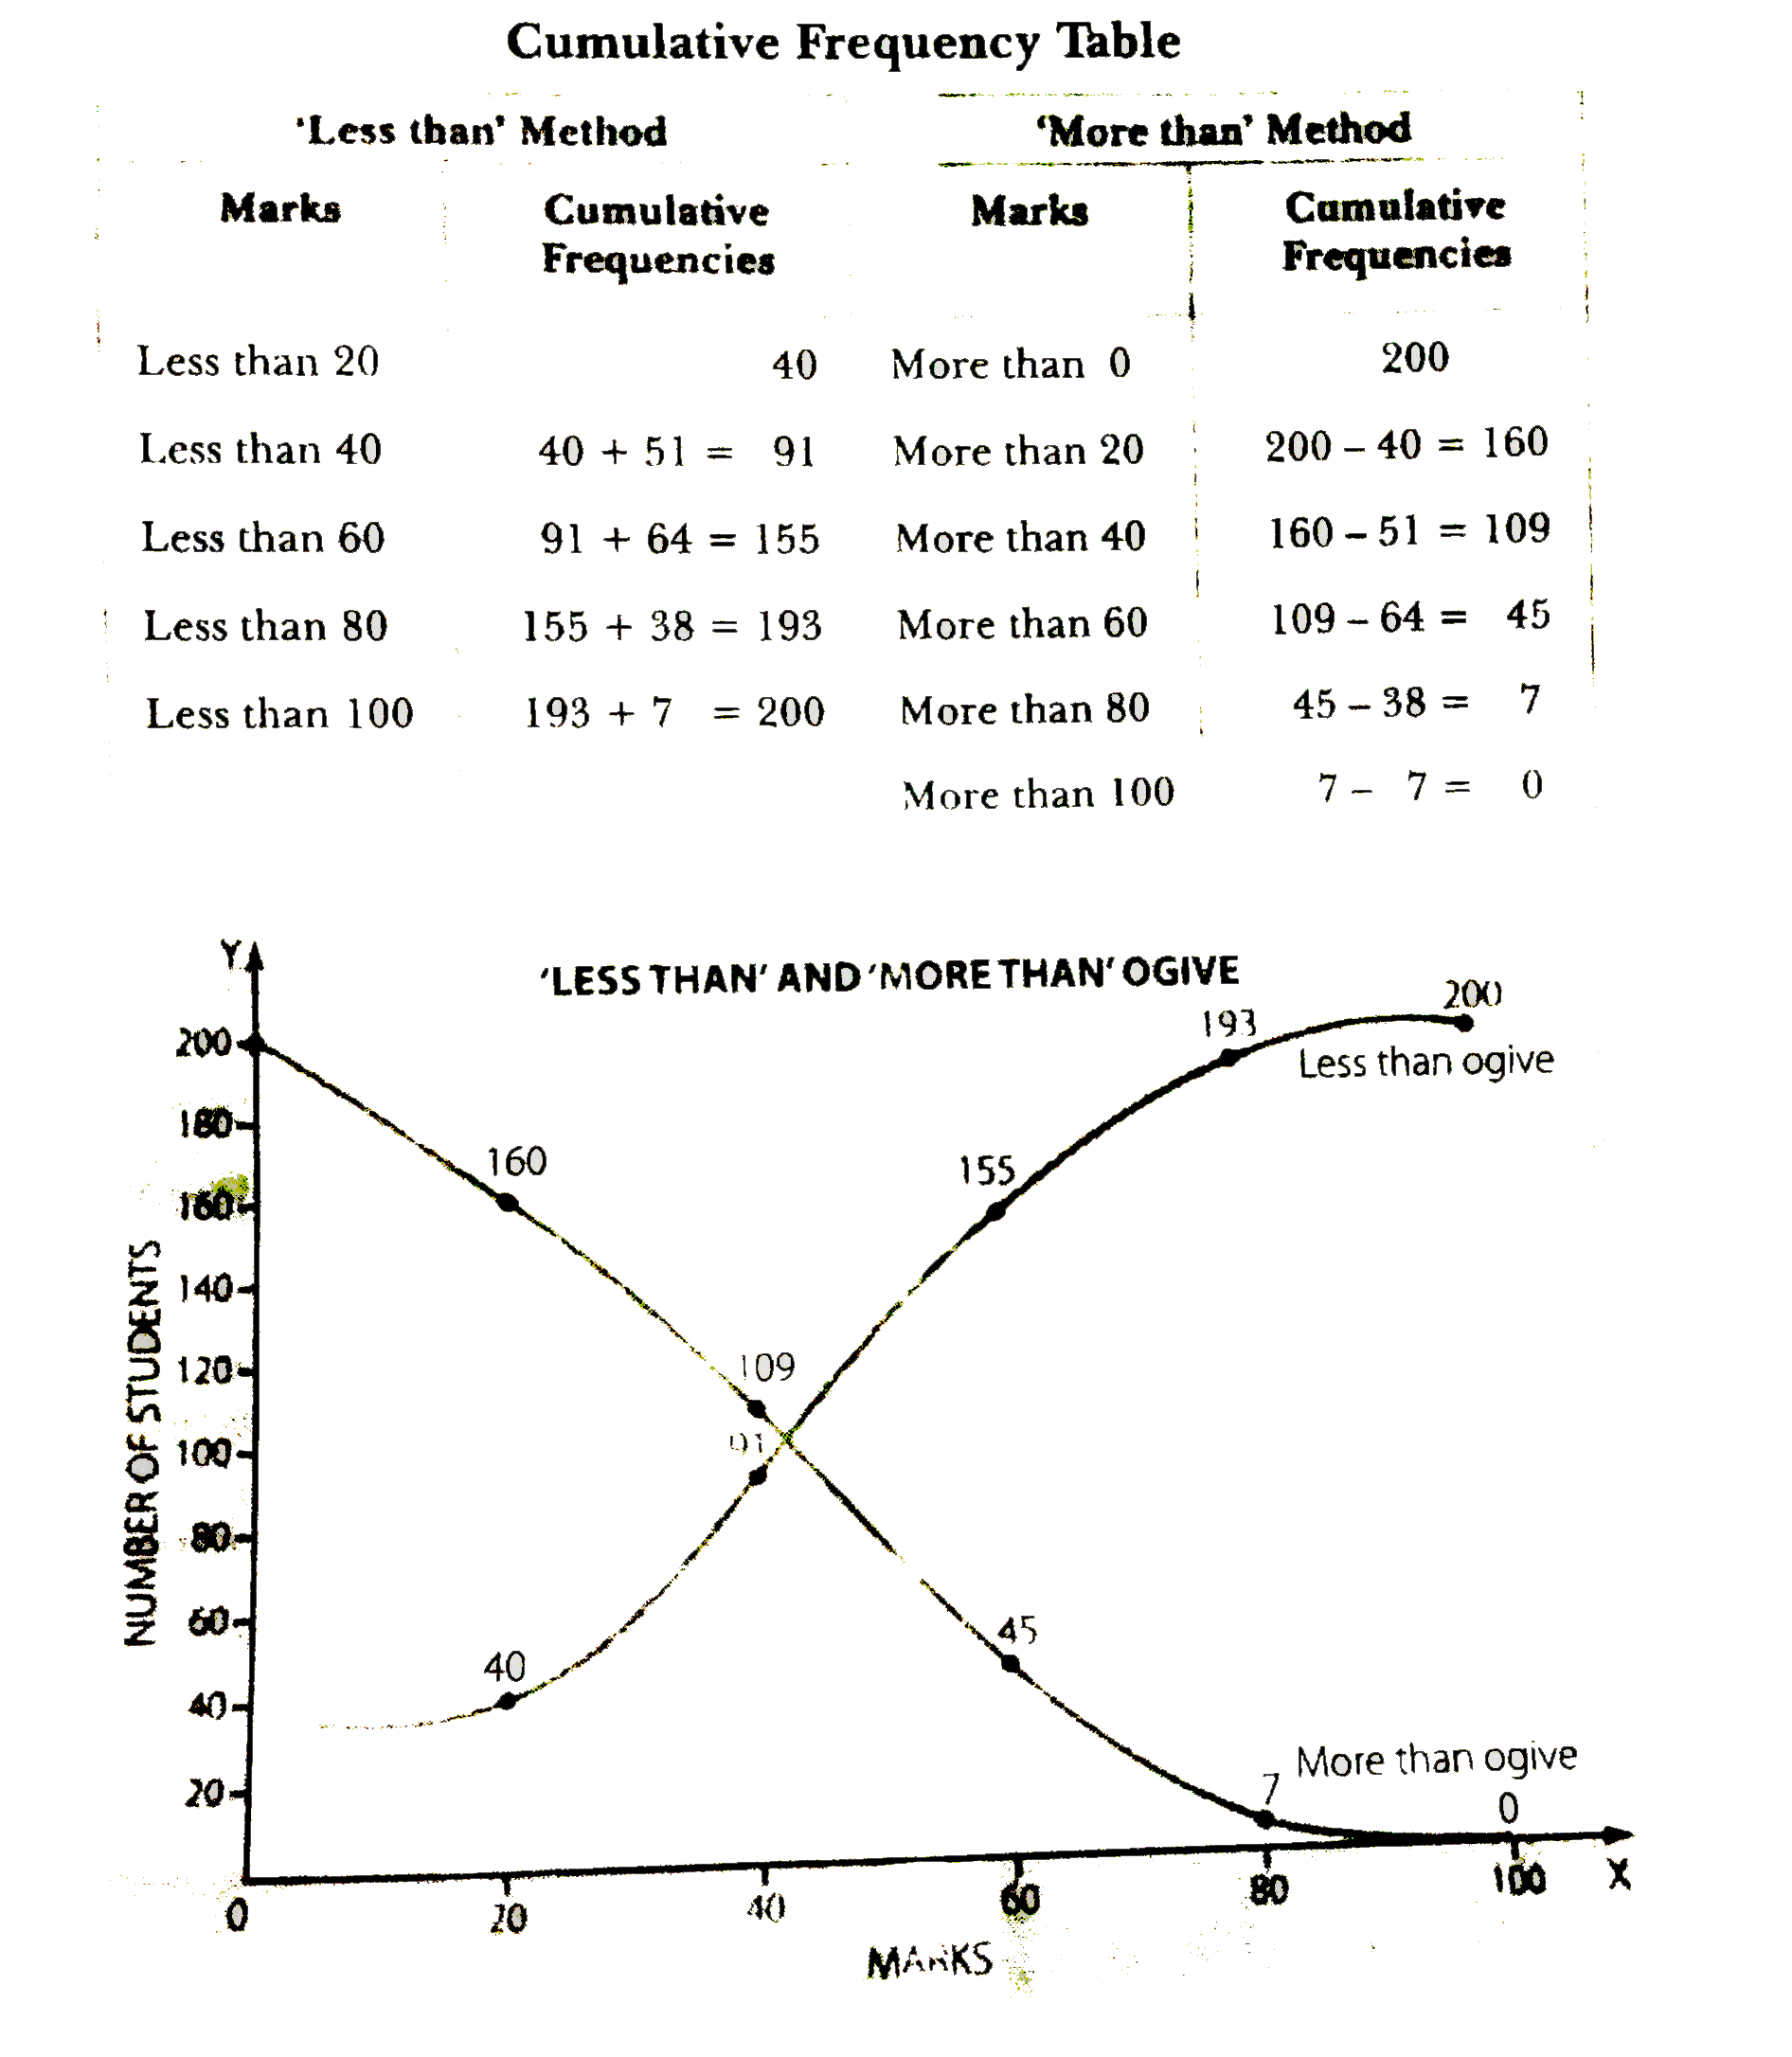
- Draw the 'less than' and 'more than' ogive on the same graph paper fro...
Text Solution
|
- Construct a histogram from the following data :
Text Solution
|
- Draw histogram and frequency polygon for the following distribution :
Text Solution
|
- Represent the following data by frequency curve :
Text Solution
|
- Draw a histogram, a frequency polygon and frequency curve of the follo...
Text Solution
|
- Draw the 'less than' and 'more than' ogive on the same graph paper fro...
Text Solution
|