


Topper's Solved these Questions
FREQUENCY DIAGRAMS - HISTOGRAM, POLYGON AND OGIVE
TARUN JAIN & VK OHRI|Exercise EXERCISE NCERT|7 VideosFREQUENCY DIAGRAMS - HISTOGRAM, POLYGON AND OGIVE
TARUN JAIN & VK OHRI|Exercise EXERCISE CONCEPT BASED OBJECTIVE|5 VideosDIAGRAMMATIC PRESENTATION OF DATA BAR DIAGRAMS AND PIE DIAGRAMS
TARUN JAIN & VK OHRI|Exercise NCERT Question (With Hints to Answers)|3 VideosINDEX NUMBERS
TARUN JAIN & VK OHRI|Exercise NCERT Questions (With Hints to Answers)|12 Videos
Similar Questions
Explore conceptually related problems
TARUN JAIN & VK OHRI-FREQUENCY DIAGRAMS - HISTOGRAM, POLYGON AND OGIVE-EXERCISE ESSENTIAL PRACTICALS
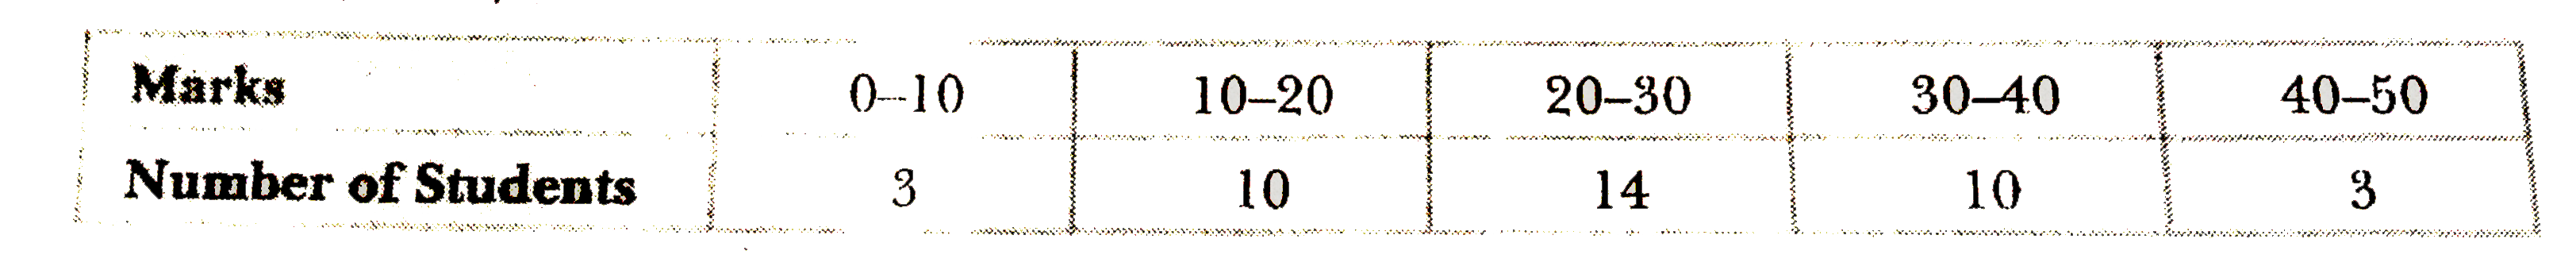
- Make a frequency polygon and histogram using the given data :
Text Solution
|
- Draw 'less than' and 'more than' ogive curves from the following data ...
Text Solution
|
- Present the data given in the table below in a histogram :
Text Solution
|
- Draw a histogram from the following data relating to the monthly pocke...
Text Solution
|
- We are given the following marks secured by 25 students in an examinat...
Text Solution
|
- Present the following data in the form of a histogram :
Text Solution
|
- The frequency distribution of marks obtained by students in a class te...
Text Solution
|
- (i)Construct a histogram and frequency polygon of the following distri...
Text Solution
|
- Draw a frequency polygon from the following data by using (i) histogra...
Text Solution
|
- Draw 'less than' as well as 'more than' ogives for the following data ...
Text Solution
|