Home
Class 11
ECONOMICS
Following table gives hypothetical figur...

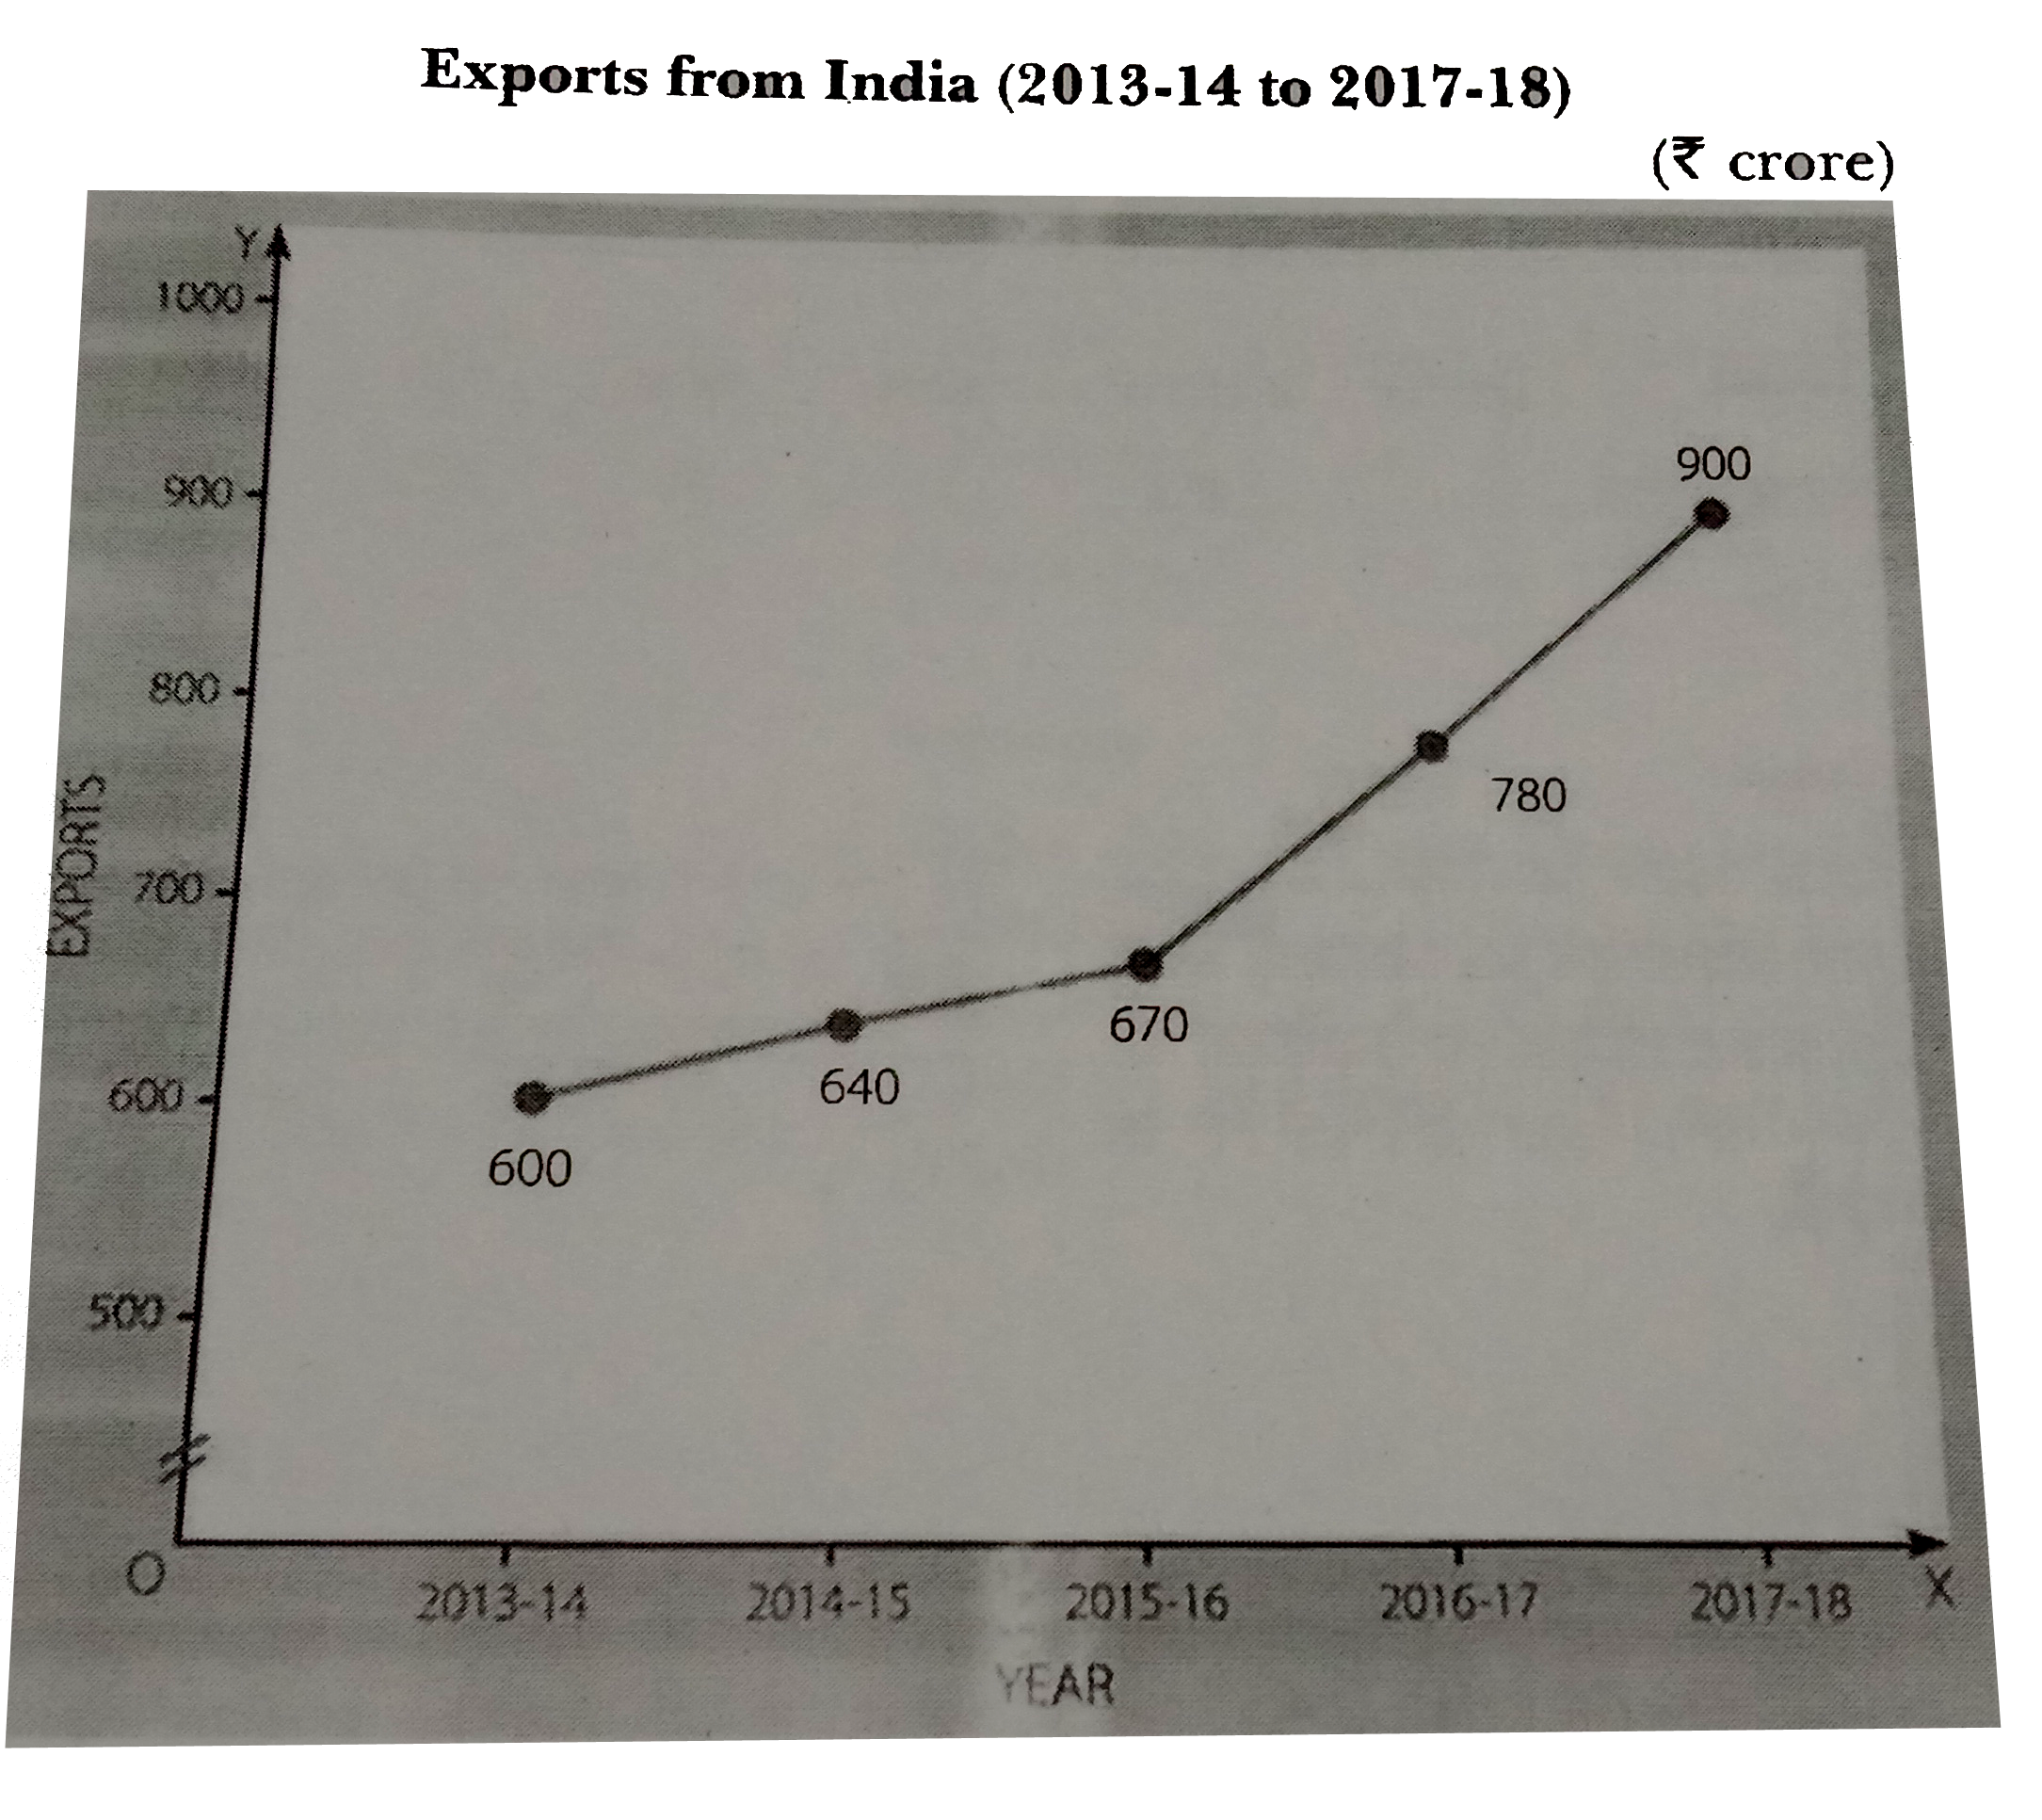
Following table gives hypothetical figures of exports from India during the years 2013-14 to 2017-18. Present the information in the form of a suitable graph.
`{:("Year",2013-14,2014-15,2015-16,2016-17,2017-18),("Exports (Rs. core)" ,600,640,670,780,900):}`

Text Solution

Verified by Experts

Presentation of these data involves the contruction of a false line. Because: (i) difference between the minimum export value and zero is very large, and (ii) various values of exports show large difference. Data are presented in a graph with a false base line as under :
Doubtnut Promotions Banner Mobile Dark
|

Topper's Solved these Questions

  • ARITHMETIC LINE-GRAPHS OR TIME SERIES GRAPHS

    TARUN JAIN & VK OHRI|Exercise A. Mupltiple Choice Questions|6 Videos
  • ARITHMETIC LINE-GRAPHS OR TIME SERIES GRAPHS

    TARUN JAIN & VK OHRI|Exercise B. Fill in the blank|4 Videos
  • CENSUS AND SAMPLE METHODS OF COLLECTION OF DATA

    TARUN JAIN & VK OHRI|Exercise NCERT Question|9 Videos

Similar Questions

Explore conceptually related problems
Plot the annual profits of a firm on a time series graph: {:("Year",2013,2014,2015,2016,2017,2018),("Profit ('000 Rs.)",60,72,75,65,80,95):}

Following information relates to the exports form India to USSR and UK in the year 2015, 2016, 2017 and 2018 (hypothetical figures). Present it in the form of a table.

Knowledge Check

  • The following table shows the pass percentage of results of four schools in the past four year . In which academic year did all the schools have pass percentage as more than 80? A)2012-13 B)2014-15 C)2015-16 D) 2013-14

    A
    2012-13
    B
    2014-15
    C
    2015-16
    D
    2013-14
  • The given Bar graph presents the Export of Tea and Coffe ( in million kg ) for the years 2012 to 2016. What is thr ratio of total export of tea in 2012 , 2014 and 2015 to the total export of coffee in 2013 and 2014 ?

    A
    `6:5`
    B
    `10:9`
    C
    `9:10`
    D
    `5:6`
  • Similar Questions

    Explore conceptually related problems

    Represent the following data (hypothetical data) graphically: {:("Year",2012,2013,2014,2015,2016,2017,2018),("Production of Wheat (in million tonnes)",5,8,13,16,20,17,22):}

    The following table shows Production of Electricity from different Sources in India during 2014-15 to 2017-18 (hypothetical data). Present the data in a sub-divided bar diagram.

    Taking 2004 as base year, construct the index numbers of the year 2014 and 2018. {:("Year",2004,2014,2015,2016,2017,2018,),("Prices (Rs.)"," 10"," 14"," 16"," 20"," 22"," 24",):}

    Represent the following data related to export and imports to India (hypothetical figures) graphically: {:("Year",2012,2013,2014,2015,2016,2017,2018),("Exports (in Rs. crore)",300,350,400,380,450,280,250),("Imports (in Rs. crore)",420,460,600,480,550,450,400):}

    Represent the following data related to population (in thousands) of men and women in a village in different years graphically: {:("Year",2012,2013,2014,2015,2016,2017,2018),("Number of Men",10,13,15,14,17,18,21),("Number of Women",12,18,16,17,20,22,24):}

    Plot the following hypothetical figures on time series graphs: {:("Year","Imports(Rs. thousand crore)","Exports (Rs. thousand crore)"),(2013-14," "123," "106),(2014-15," "178," "140),(2015-16," "215," "159),(2016-17," "231," "203),(2017-18," "245," "209):}