


Topper's Solved these Questions
ARITHMETIC LINE-GRAPHS OR TIME SERIES GRAPHS
TARUN JAIN & VK OHRI|Exercise NCERT Questions|2 VideosARITHMETIC LINE-GRAPHS OR TIME SERIES GRAPHS
TARUN JAIN & VK OHRI|Exercise Long Answer Type Questions|3 VideosCENSUS AND SAMPLE METHODS OF COLLECTION OF DATA
TARUN JAIN & VK OHRI|Exercise NCERT Question|9 Videos
Similar Questions
Explore conceptually related problems
TARUN JAIN & VK OHRI-ARITHMETIC LINE-GRAPHS OR TIME SERIES GRAPHS-Essential Practicals
- Plot the annual profits of a firm on a time series graph: {:("Year"...
Text Solution
|
- Plot the following hypothetical figures on time series graphs: {:("Y...
Text Solution
|
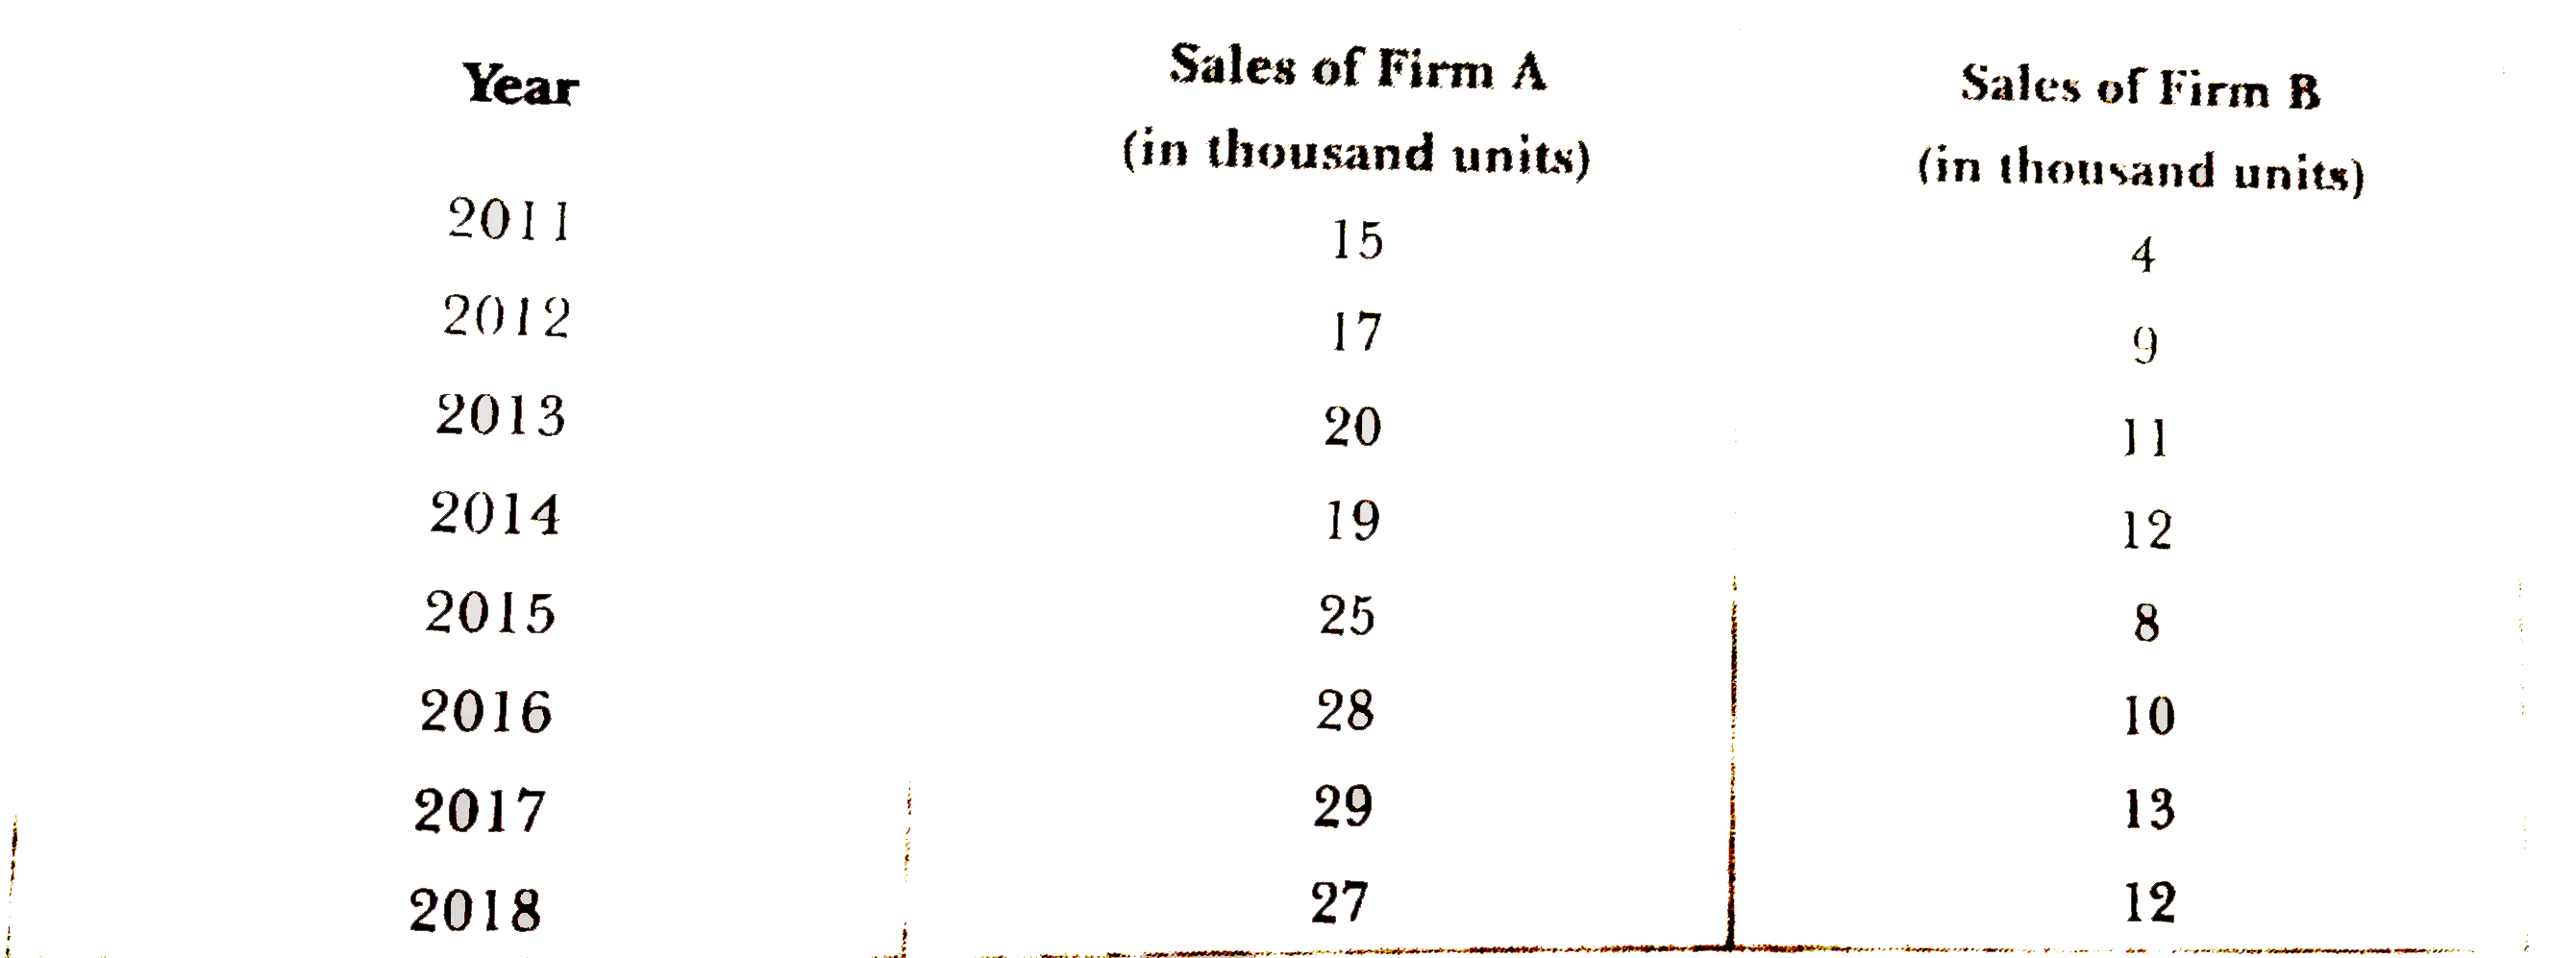
- The following are the figures of sales of two firms A and B for the ye...
Text Solution
|
- The following are the sales figures of TVs of Firm A, during 2013, 201...
Text Solution
|