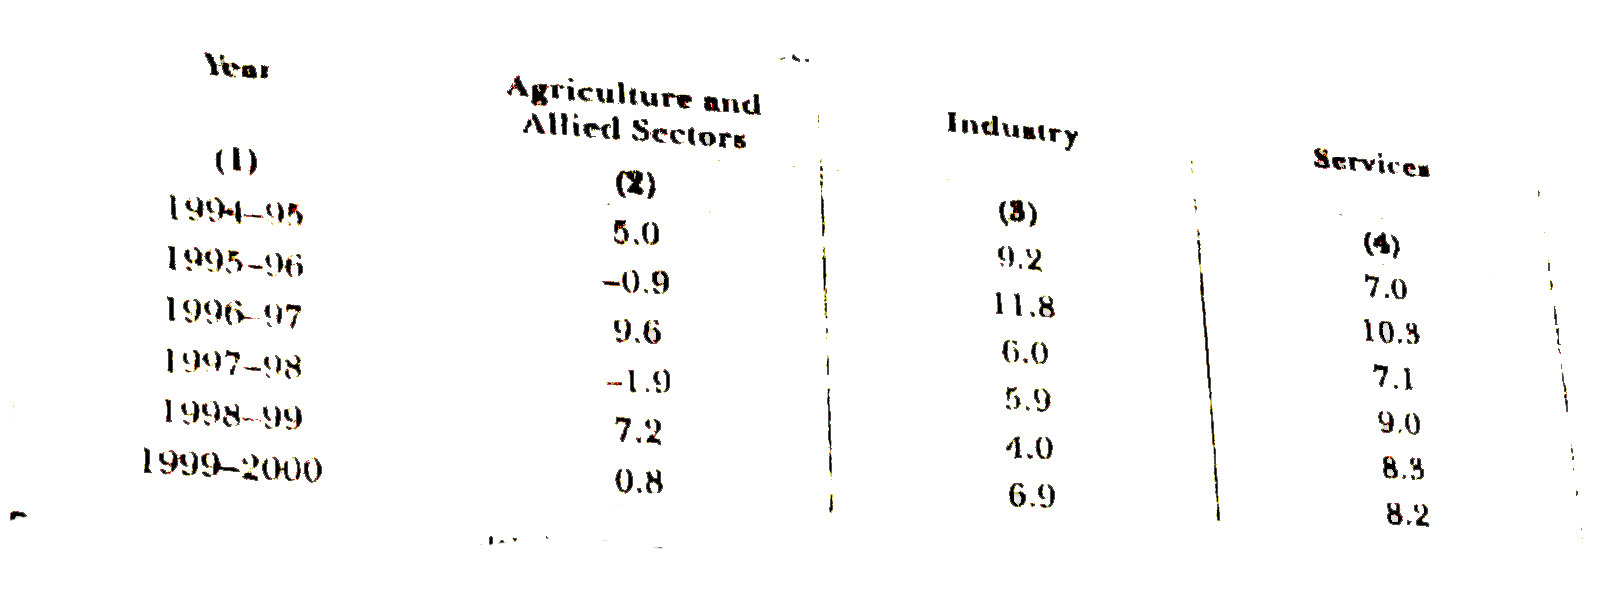
The following table shows the estimated sectoral real growth rates (percentage change over the previous year) in GDP at factor cost. Represent the data as multiple time series graph.
The following table shows the number of fruits in a fruit shop.Represent the above data by a bar graph
. The following data shows the year wise strength of a school.Represent the the above data by bar graph:
The following table shows the number of illitrate persons in the age group (10-58 Years) in a town. Represents the given data by means of a histogram.
The following table shows the percentage of buyers of four different brands of bathing soaps. Represent the above data by a pie chart.
The following table shows birth and death rate in India according to the Census Reports between 1931 - 40 to 2016-17 (hypothetical figures). Present the data in te form of a multiple bar diagram.
The following table shows the average intake of nutrients in calories by rural and urban groups in a particular year. Using a suitable scale for the given data, draw a double bar graph to compare the data.
Following tables shows estimates of cost of production of certain commodities. Present the data in the form of sub divided bar diagram:
TARUN JAIN & VK OHRI-ARITHMETIC LINE-GRAPHS OR TIME SERIES GRAPHS-NCERT Questions