Text Solution
Verified by Experts
The correct Answer is:


Topper's Solved these Questions
CORRELATION
TARUN JAIN & VK OHRI|Exercise NCERT Questions (with Hints to Answers)|10 VideosCORRELATION
TARUN JAIN & VK OHRI|Exercise Long answer type questions|7 VideosCONCEPT OF ECONOMICS AND SIGNIFICANCE OF STATISTICS IN ECONOMICS
TARUN JAIN & VK OHRI|Exercise NCERT Questions|6 VideosDIAGRAMMATIC PRESENTATION OF DATA BAR DIAGRAMS AND PIE DIAGRAMS
TARUN JAIN & VK OHRI|Exercise NCERT Question (With Hints to Answers)|3 Videos
Similar Questions
Explore conceptually related problems
TARUN JAIN & VK OHRI-CORRELATION-Essential practicals
- Make a scattered diagram of the given below. Does any relationship exi...
Text Solution
|
- Calculate cofficient of correlation of the age of husband and wife usi...
Text Solution
|
- Calculate correlation of the following data using Karl Pearson's metho...
Text Solution
|
- Using assumed average in Karl Pearson's formula , calculate cofficien...
Text Solution
|
- Find out Karl Pearson's cofficient of correlation :
Text Solution
|
- Seven students of a class secured following marks in economics and his...
Text Solution
|
- Find out rank difference of X and Y:
Text Solution
|
- Calculate cofficient of correlation of the following data with rank di...
Text Solution
|
- Seven students of teaching Economics in two universities are shown bel...
Text Solution
|
- Give three xamples of perfect correlation. Find out rank difference c...
Text Solution
|
- Calculate cofficient of correlation of the following data :
Text Solution
|
- Deviation of two series X and Y are shown . Calculate coefficient of c...
Text Solution
|
- In a baby competition, two judges accorded following ranks to 12 compi...
Text Solution
|
- In a Fancy - dress competition,two judges accorded the following ranks...
Text Solution
|
- In a beauty contest , three judges accorded following ranks to 10 part...
Text Solution
|
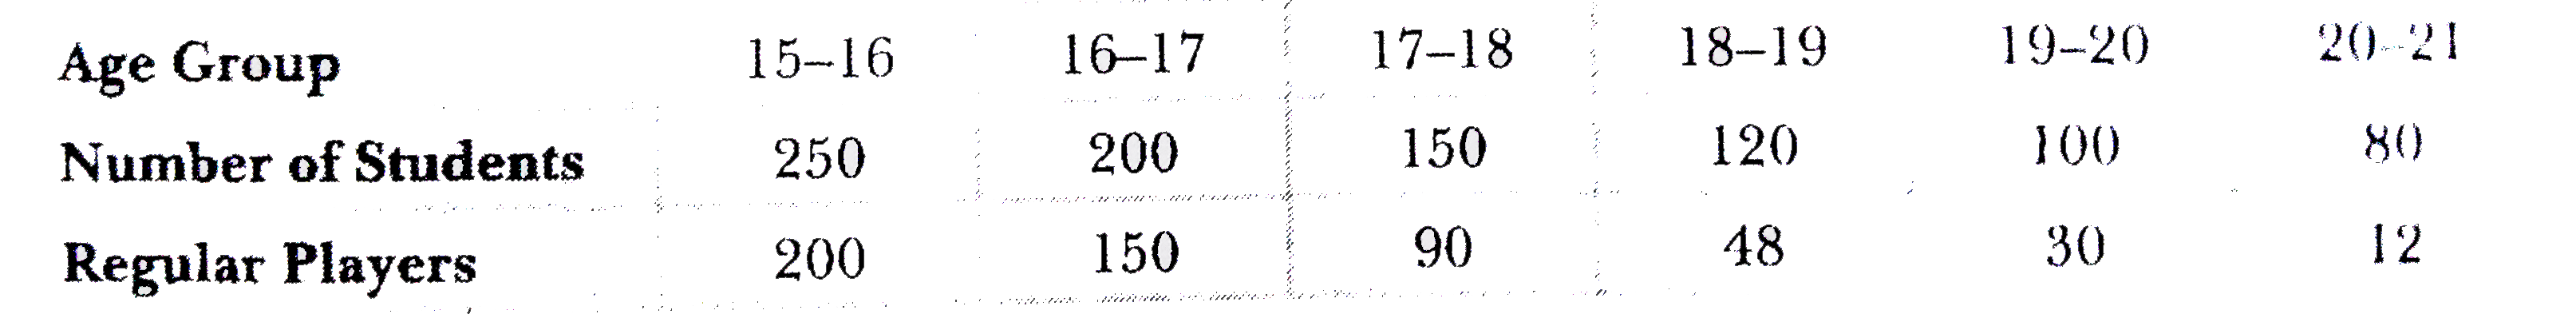
- Following data relates to age group and percentage of regular players....
Text Solution
|
- From the following data, relating to playing habits in various age gro...
Text Solution
|
- Following data relates to density of population , number of deaths and...
Text Solution
|
- From the following information, determine coefficient of correlation b...
Text Solution
|
- From the following data, determine Karl Pearson's coefficient of corre...
Text Solution
|