A
B
C
D
Text Solution
Verified by Experts
The correct Answer is:


Topper's Solved these Questions
STATES OF MATTER (GASES AND LIQUIDS)
OP TANDON|Exercise Objective questions Level B|34 VideosSTATES OF MATTER (GASES AND LIQUIDS)
OP TANDON|Exercise Assertion-Reason|10 VideosSTATES OF MATTER (GASES AND LIQUIDS)
OP TANDON|Exercise Objective questions|105 VideosSOLUTIONS (GENERAL AND COLLIGATIVE PROPERTIES)
OP TANDON|Exercise Self Assessment|31 VideosSTATES OF MATTER (SOLID STATE)
OP TANDON|Exercise SELF ASSESSMENT Section VI|3 Videos
Similar Questions
Explore conceptually related problems
OP TANDON-STATES OF MATTER (GASES AND LIQUIDS)-Set 2
- A gas described by van der Waals equation .
Text Solution
|
- According to kinetic theory of gases:
Text Solution
|
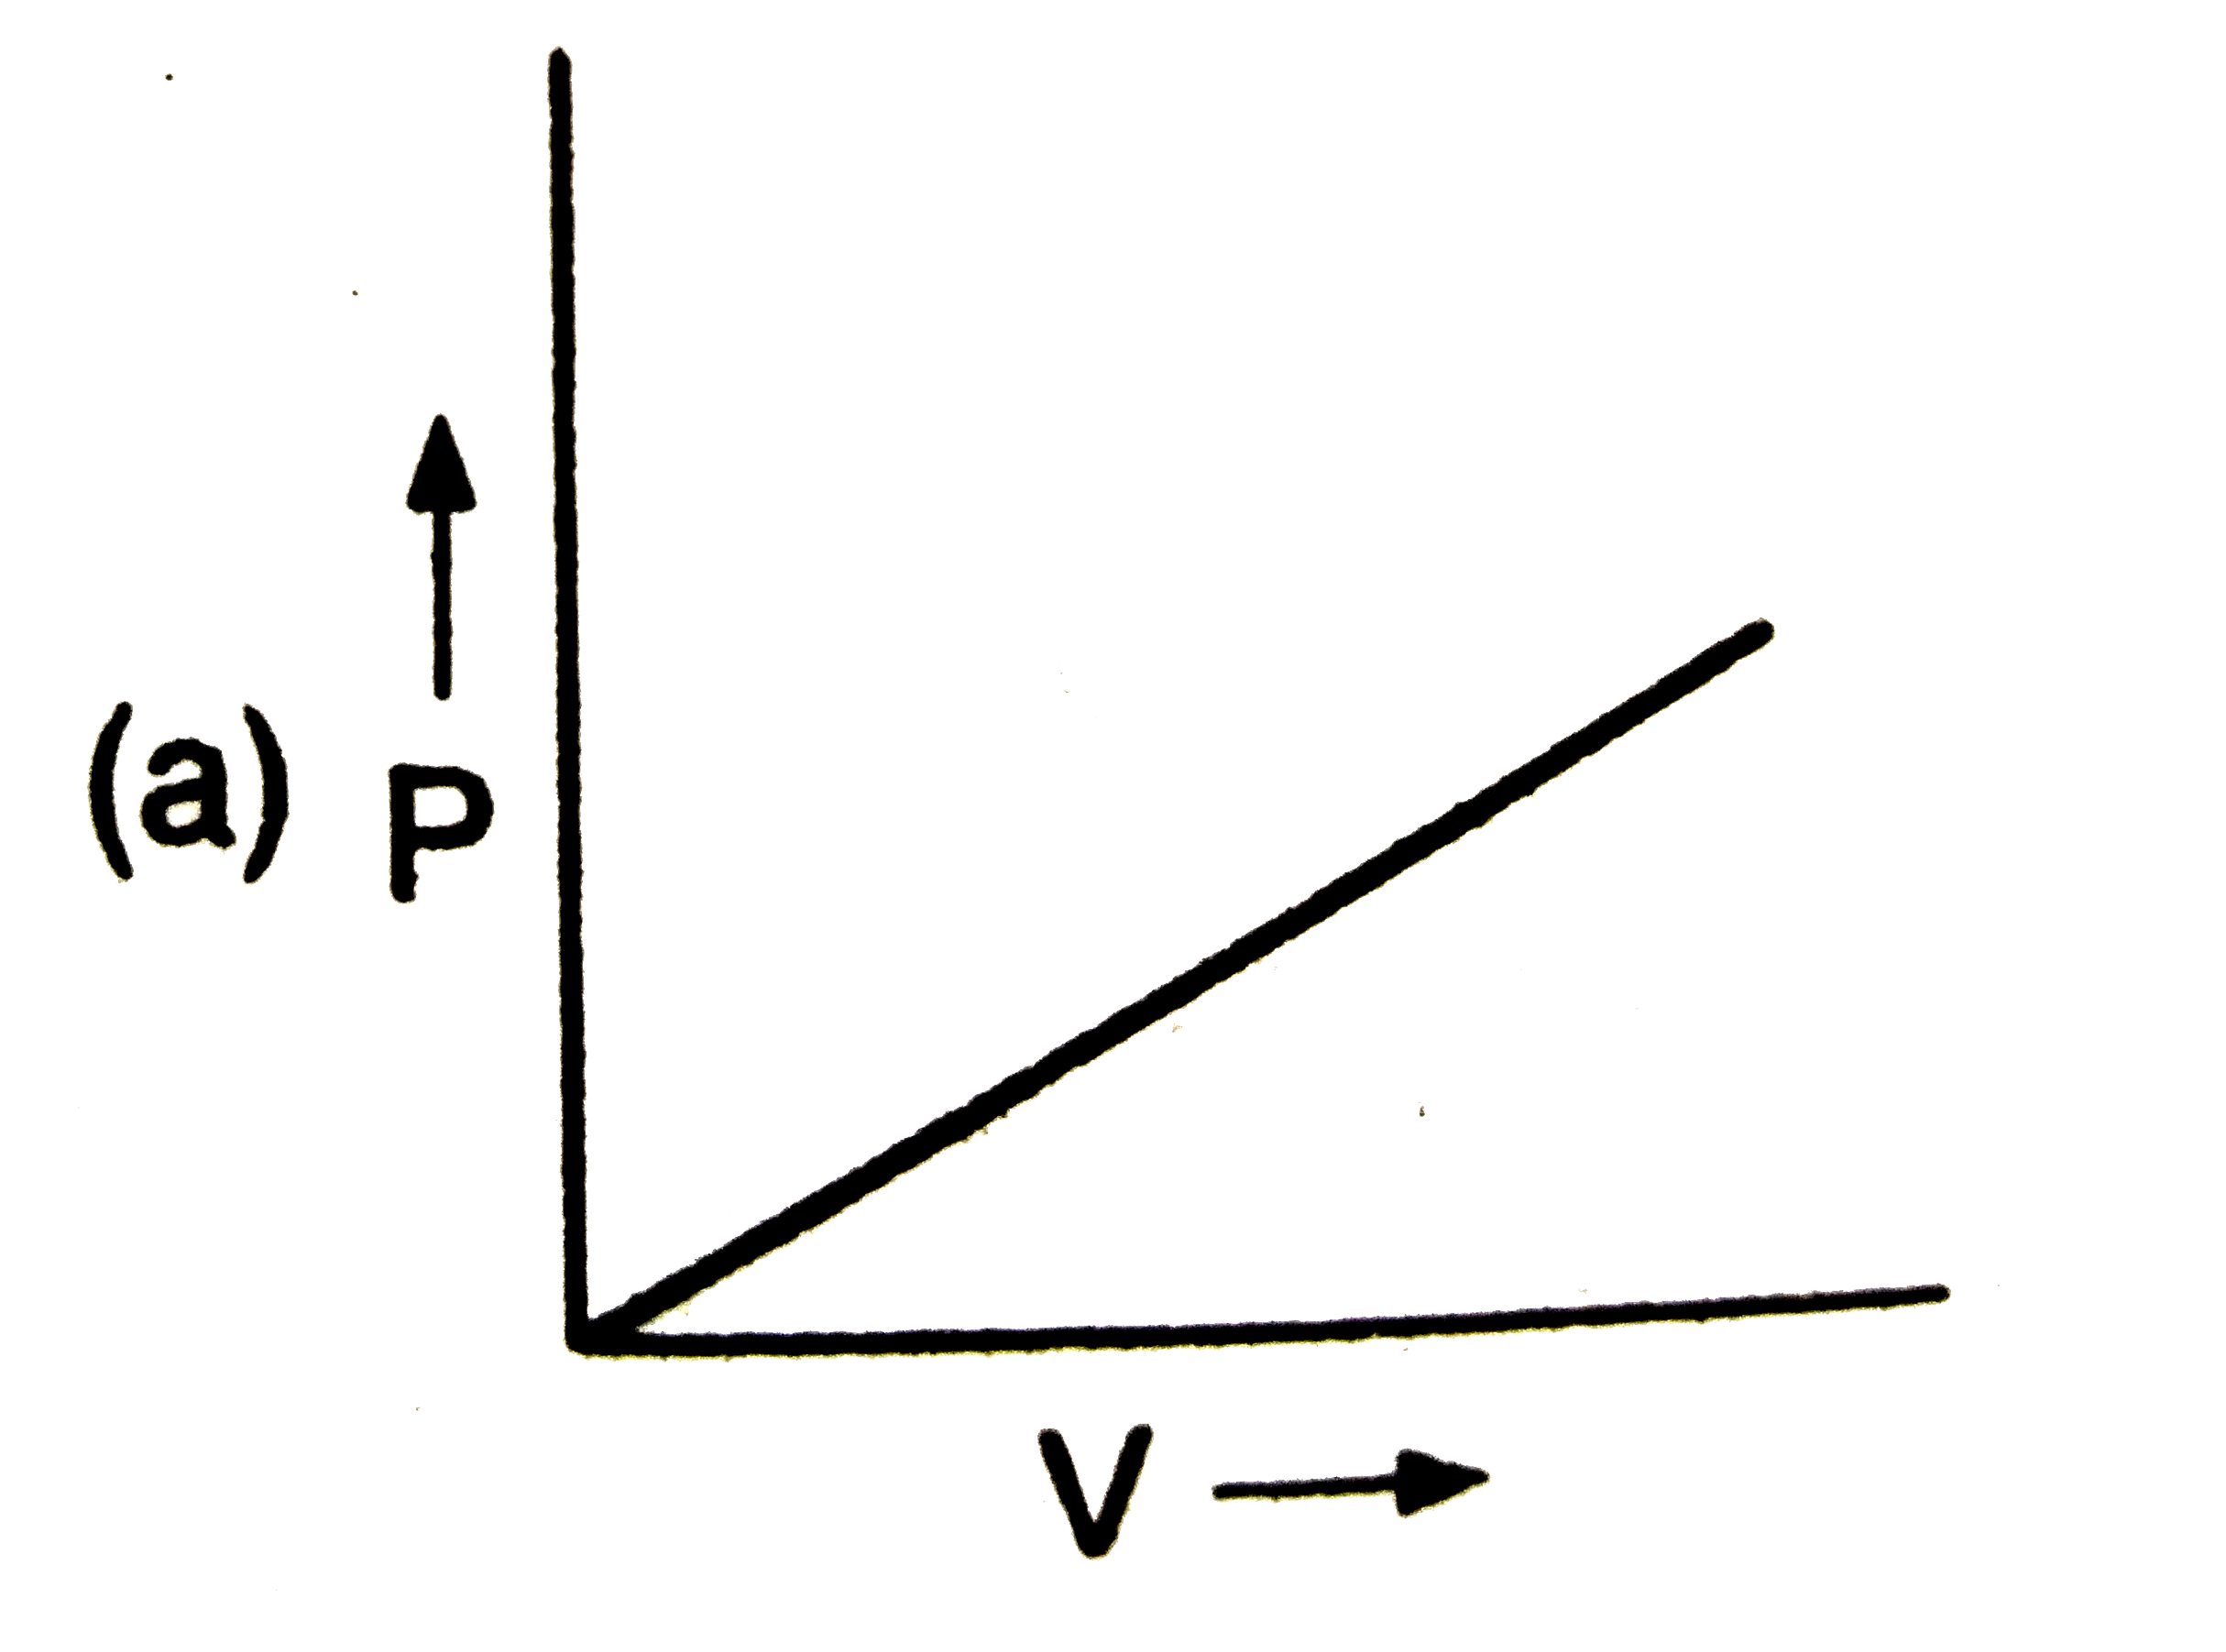
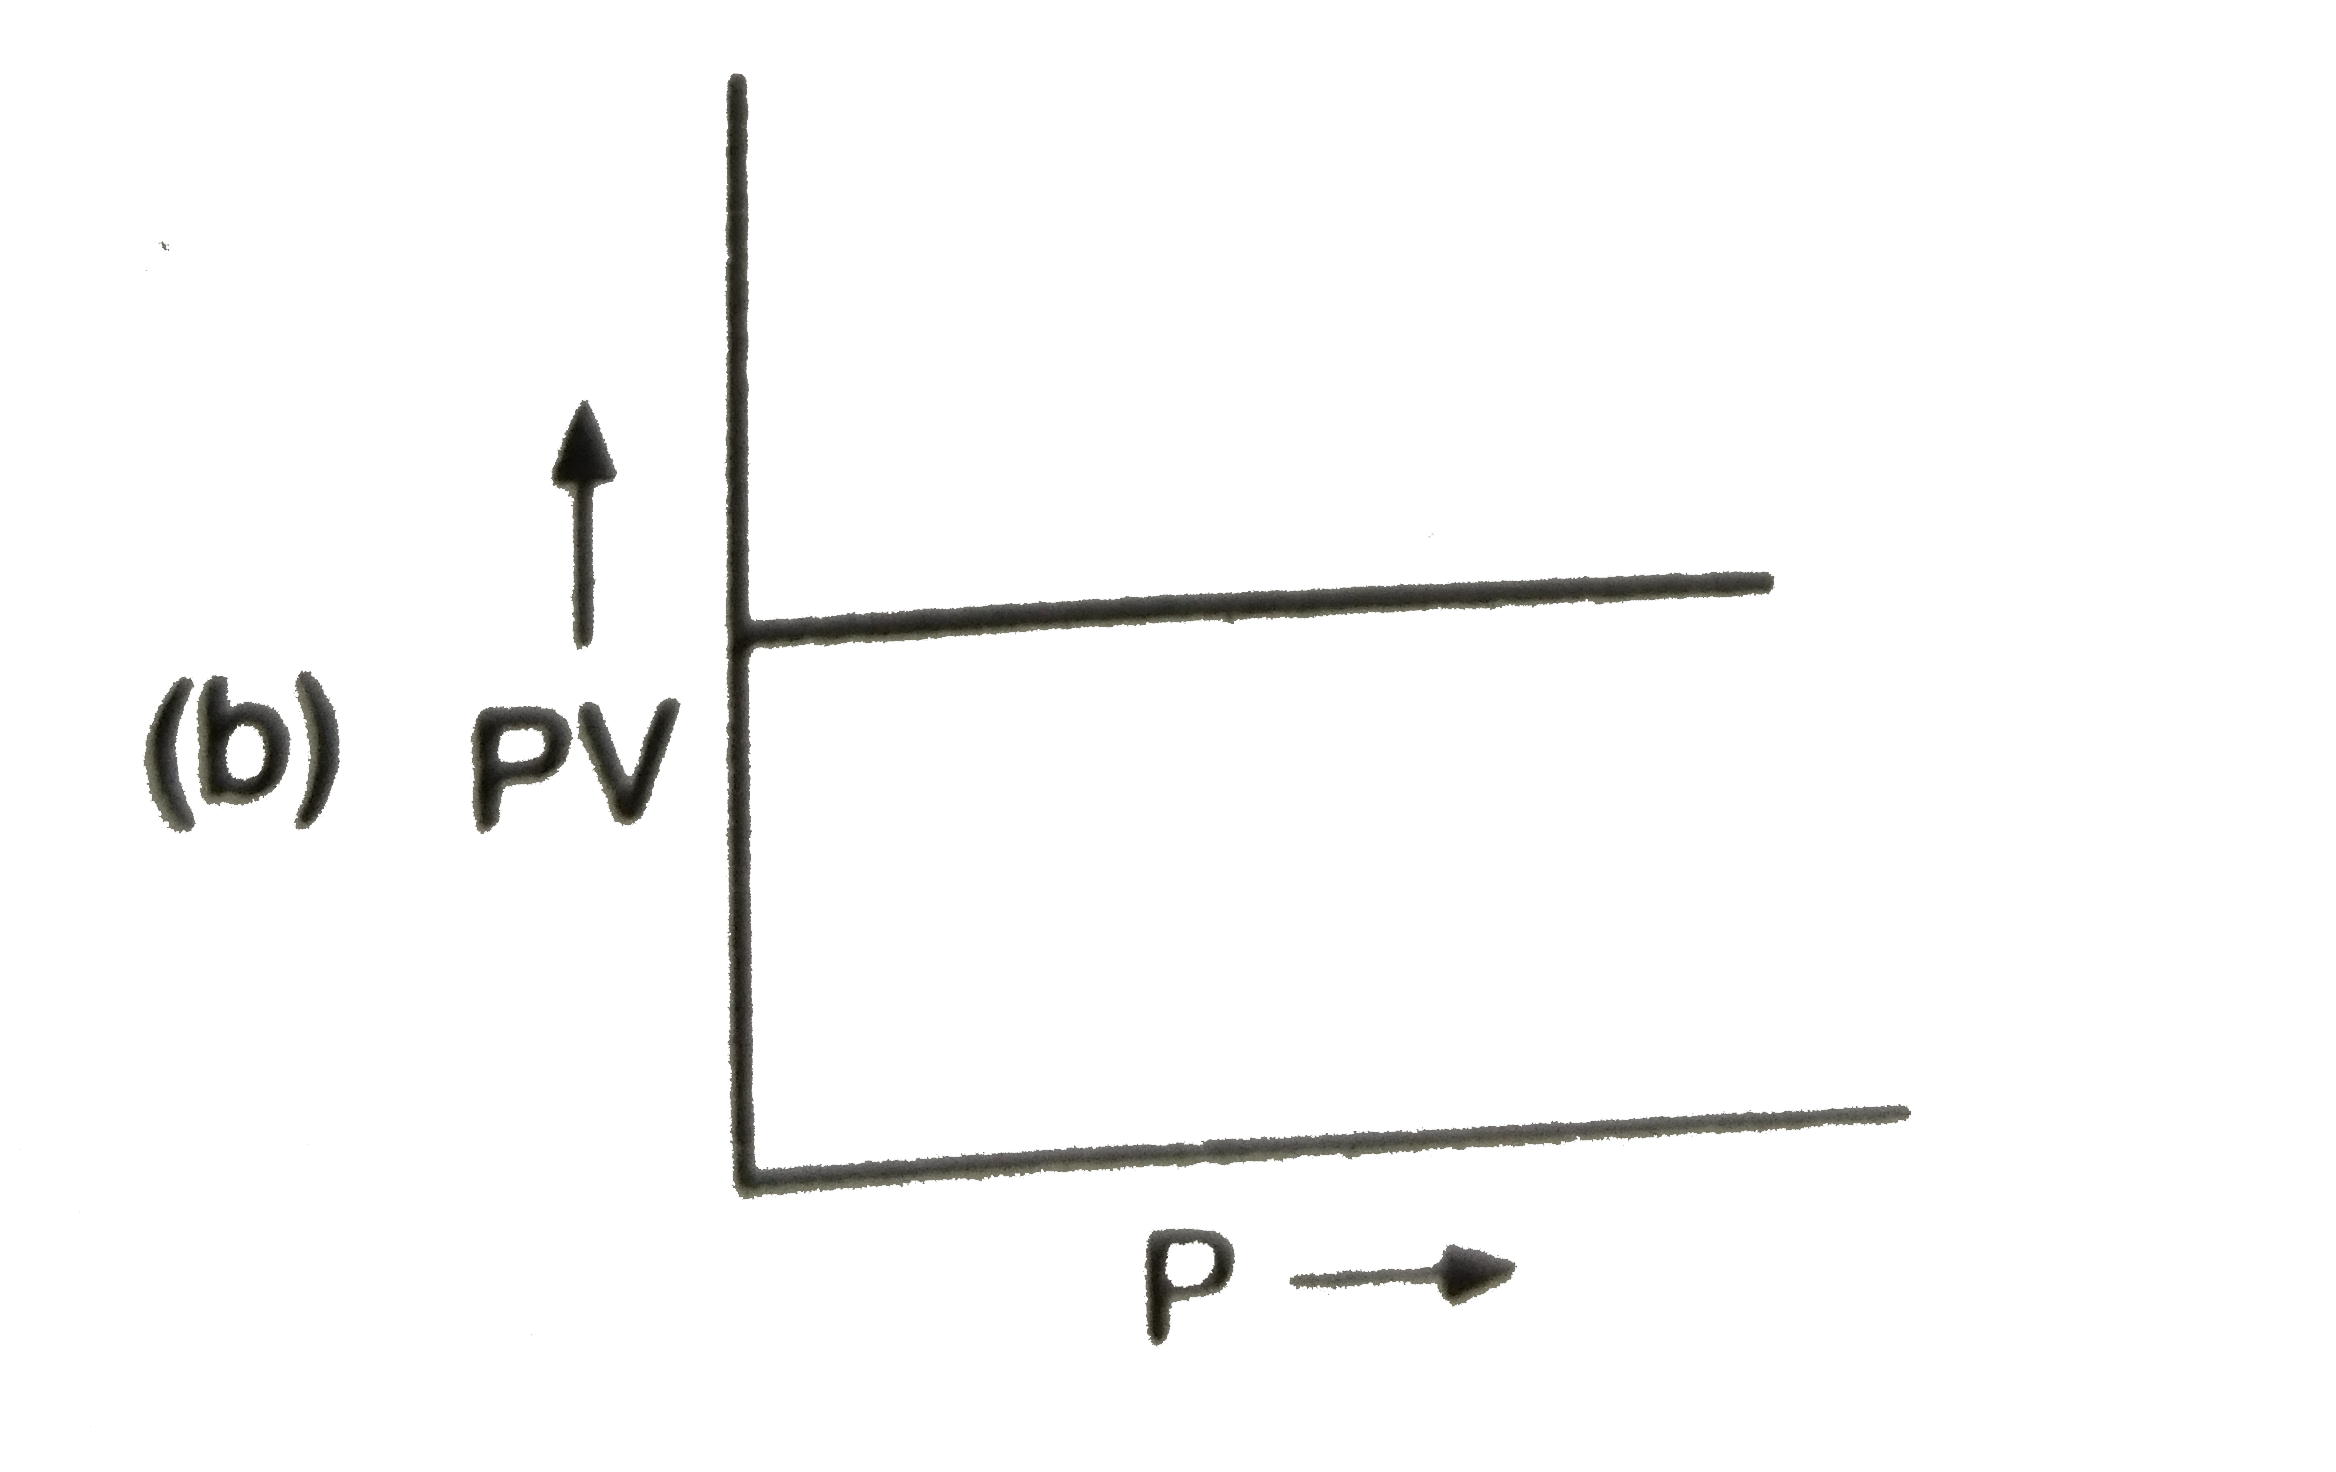
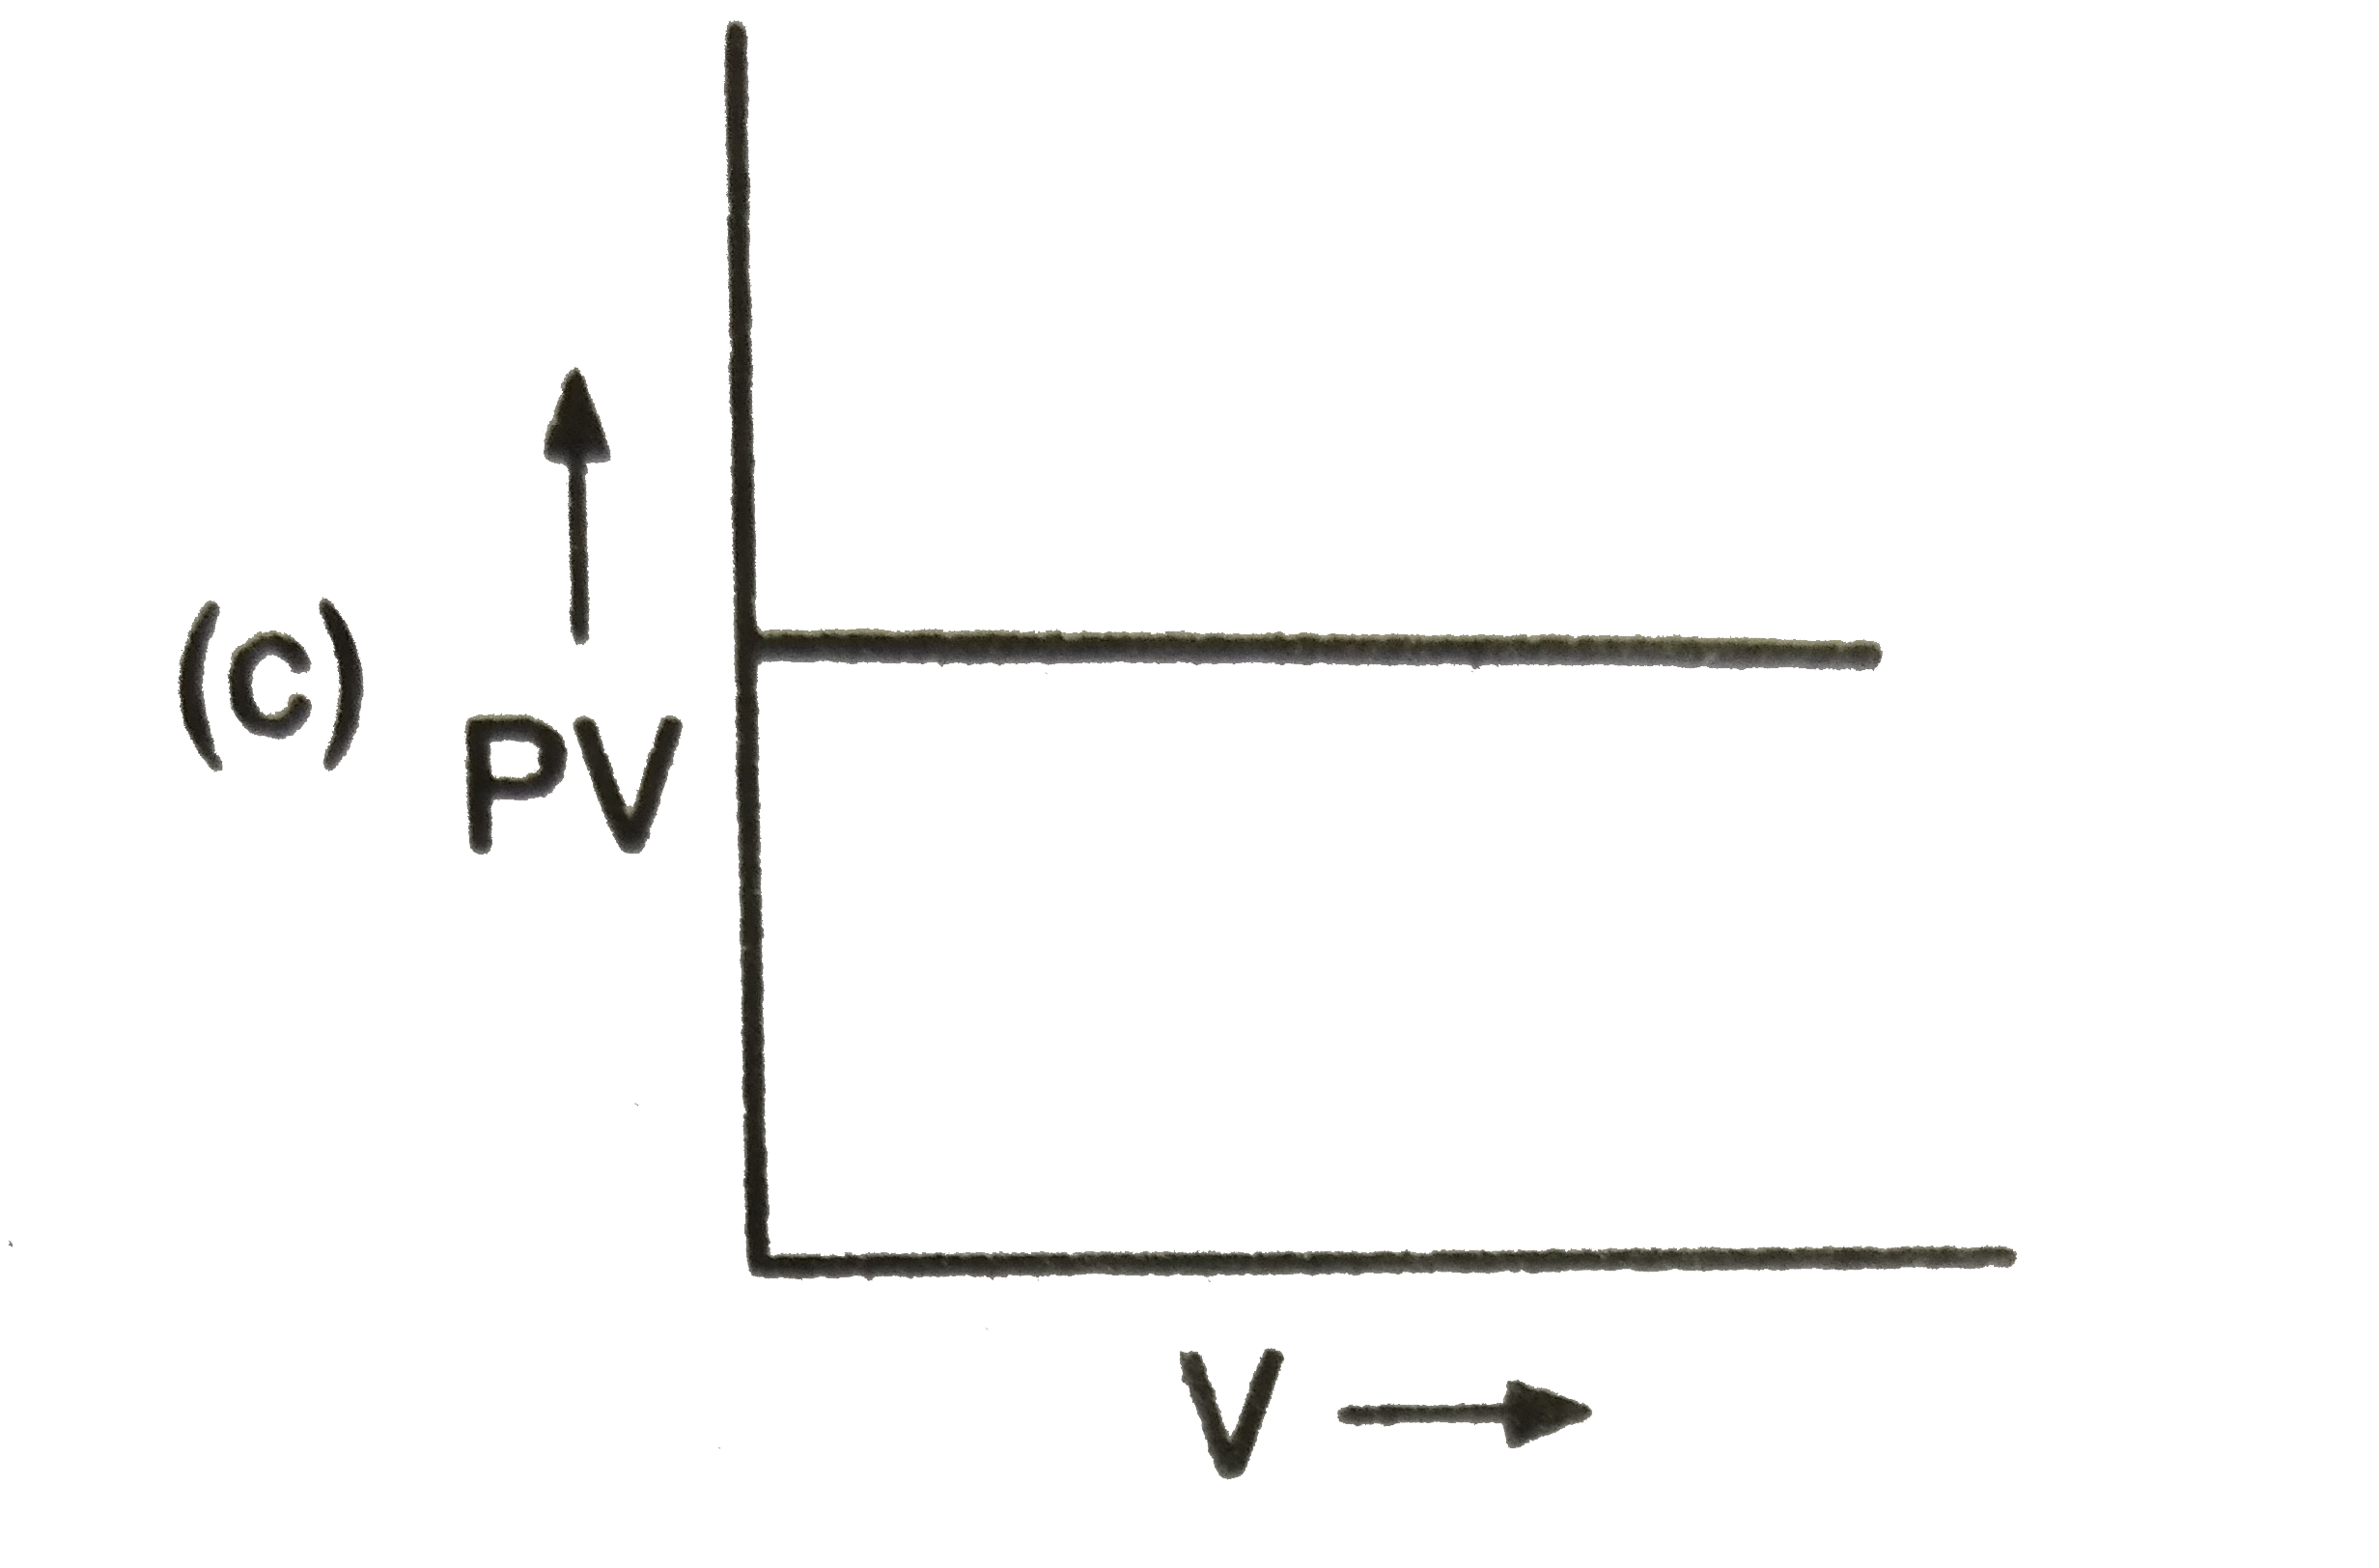
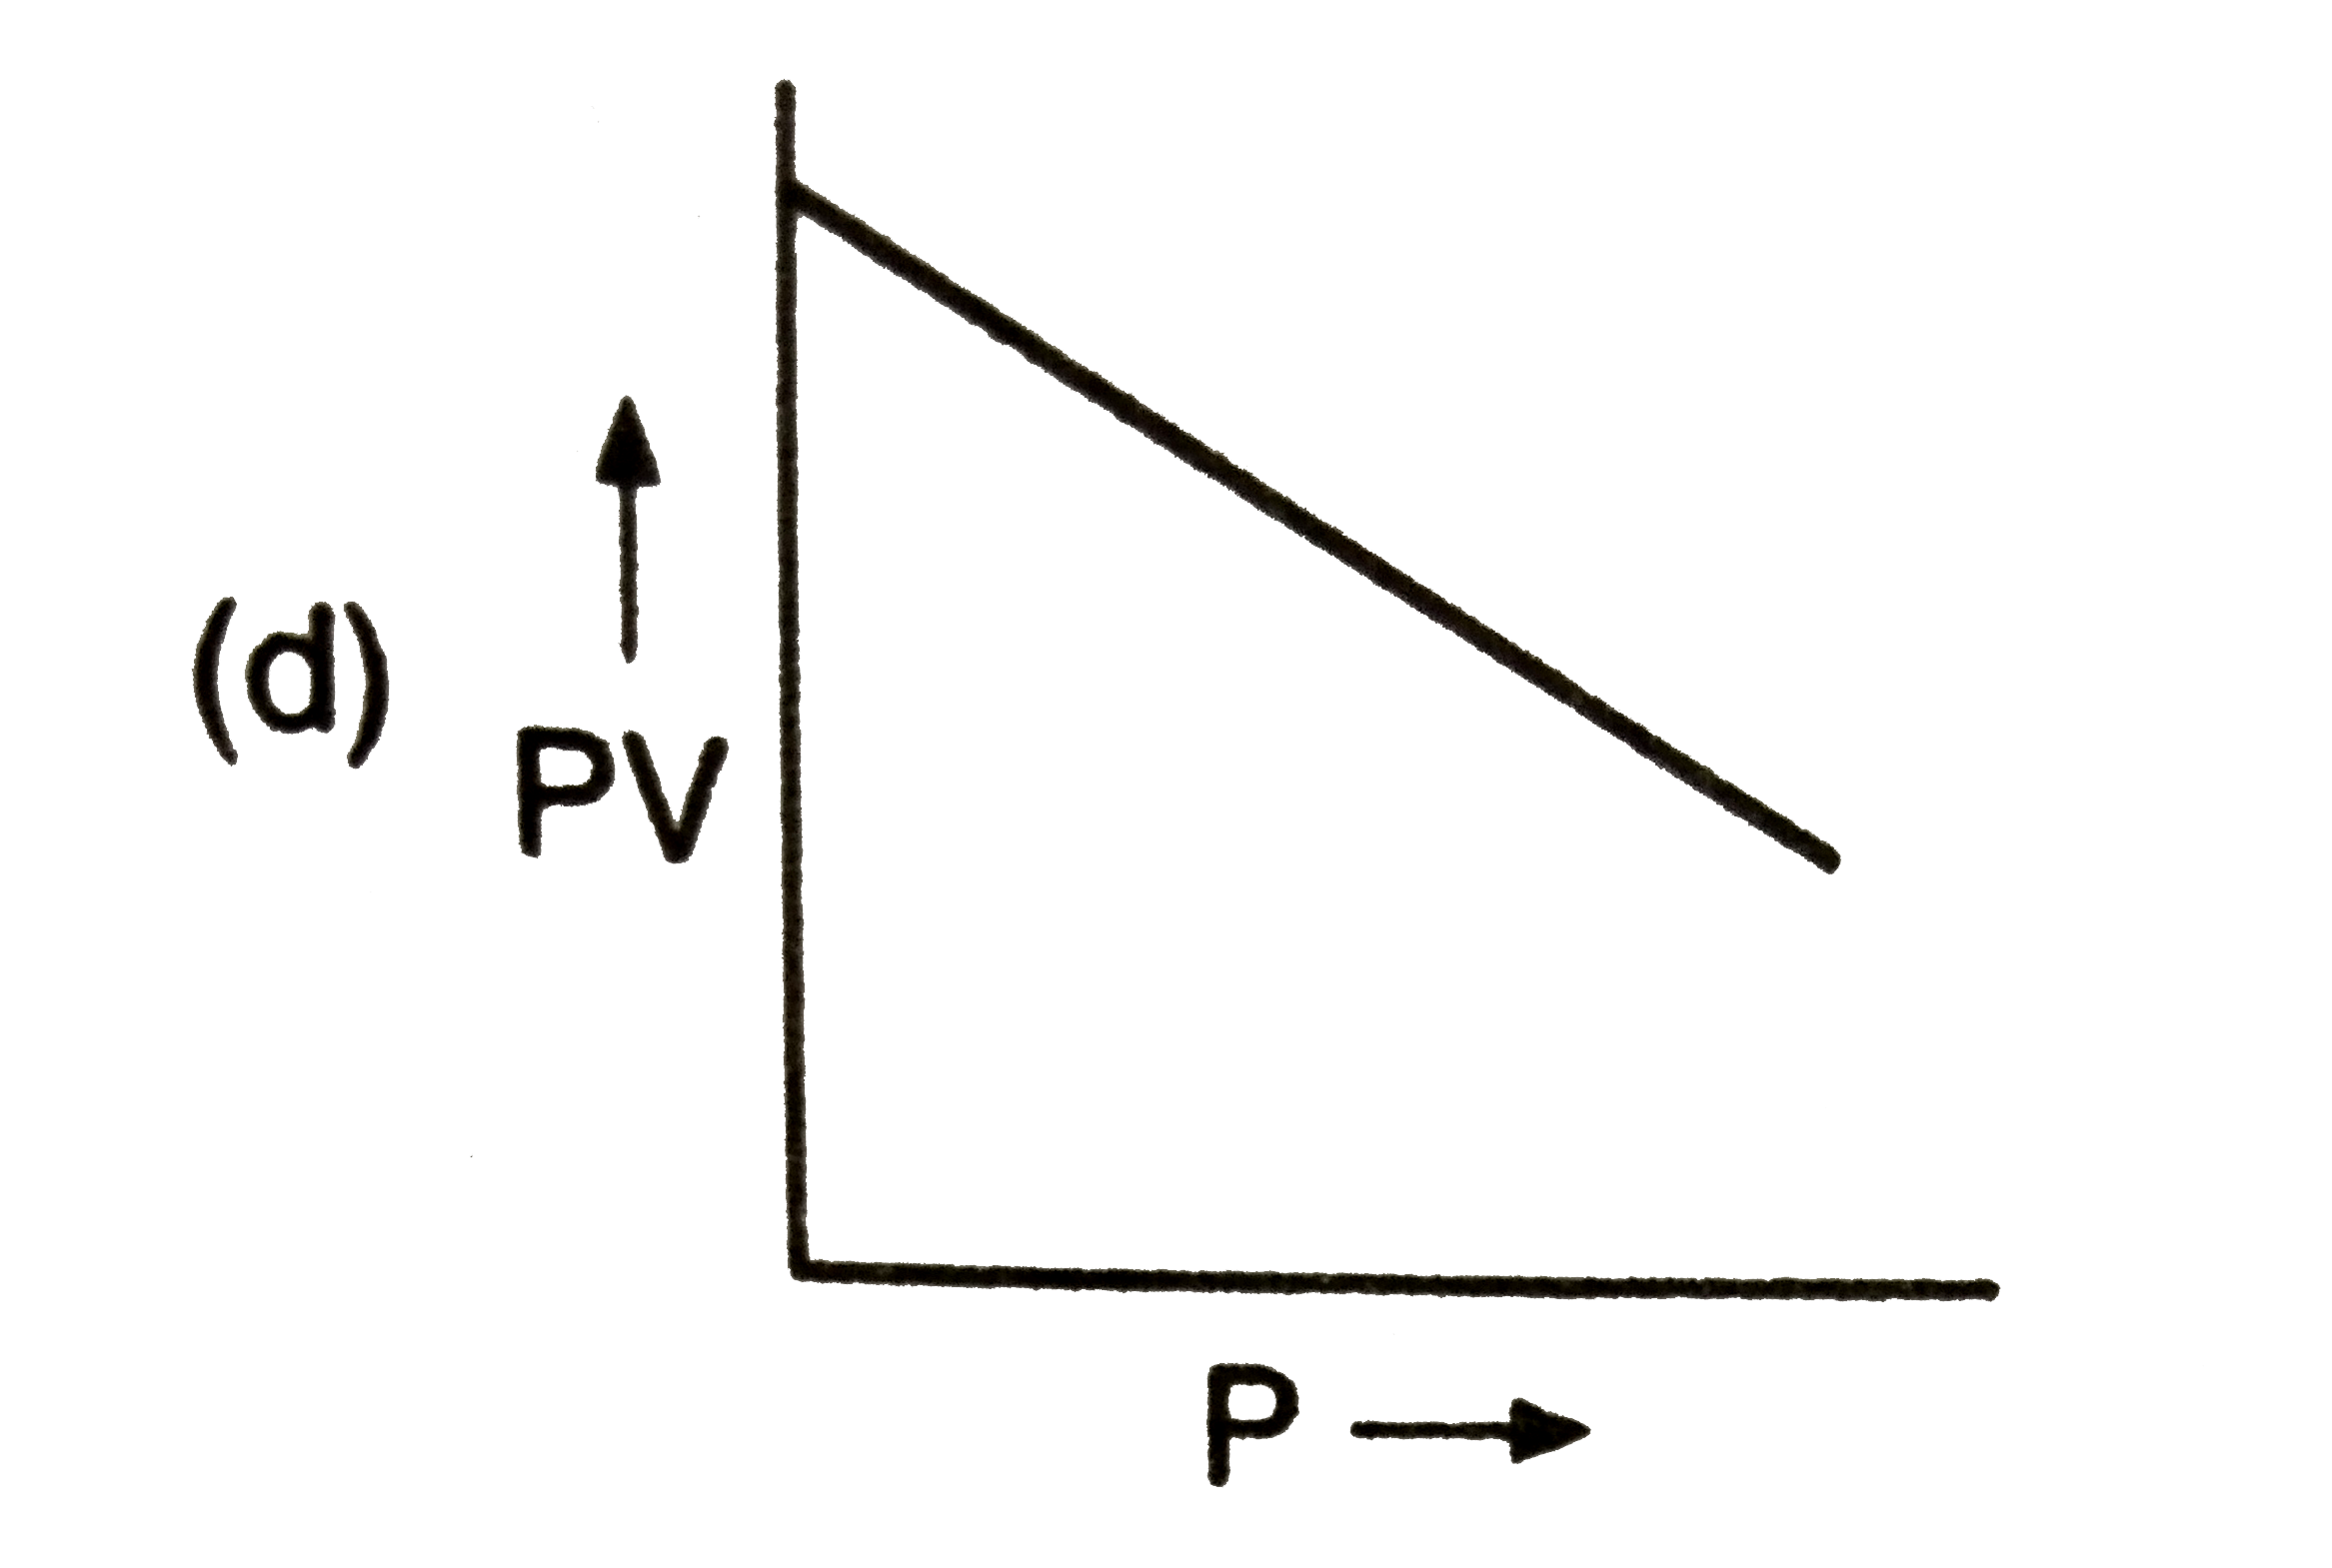
- Which of the following graph represent Boyle's law ?
Text Solution
|
- Which of the following equation (s) is/are correct on the basis of ide...
Text Solution
|
- Assertion: A gas can be easily liquefied at any temperature below is c...
Text Solution
|
- Which of the following quantities is the same for all ideal gases at t...
Text Solution
|
- Which of the following statements are correct ?
Text Solution
|
- The viscosity of a liquid molecule depends on :
Text Solution
|
- Viscosity si property of
Text Solution
|
- Which of the following diagrams correctly decribes the behavior of a f...
Text Solution
|
- The Ne atom has 10 times the mass of H(2) molecule. Which of the follo...
Text Solution
|
- Select the correct conditions indicated below the following plots :
Text Solution
|
- Assertion: Sulphur dioxide and chlorine are bleaching agents. Reason...
Text Solution
|
- Assertion: Nitrogen is unreactive at room temperature but becomes reac...
Text Solution
|
- Assertion: Noble gases can be liquefied. Reason: Attractive forces c...
Text Solution
|
- Assertion: Under similar conditions of temperature and pressure,O(2) d...
Text Solution
|
- Assertion: On compressing a gas to half the volume, the number of mole...
Text Solution
|
- Assertion: The plot of volume (V) versus pressure (P) at constant temp...
Text Solution
|
- Assertion: At constant temperature, if pressure on the gas is doubled,...
Text Solution
|
- Assertion: If H(2) and Cl enclosed separately in the same vessel exert...
Text Solution
|