A
B
C
D
Text Solution
Verified by Experts
The correct Answer is:


Topper's Solved these Questions
Similar Questions
Explore conceptually related problems
OP TANDON-MISCELLANEOUS (TOPICS OF GENERAL INTEREST)-SET-VI: Problems on graphical aptitude
- A system is taken from state A to B through three different paths 1,2 ...
Text Solution
|
- In the cyclic process shown in P-V diagram the magnitude of work done ...
Text Solution
|
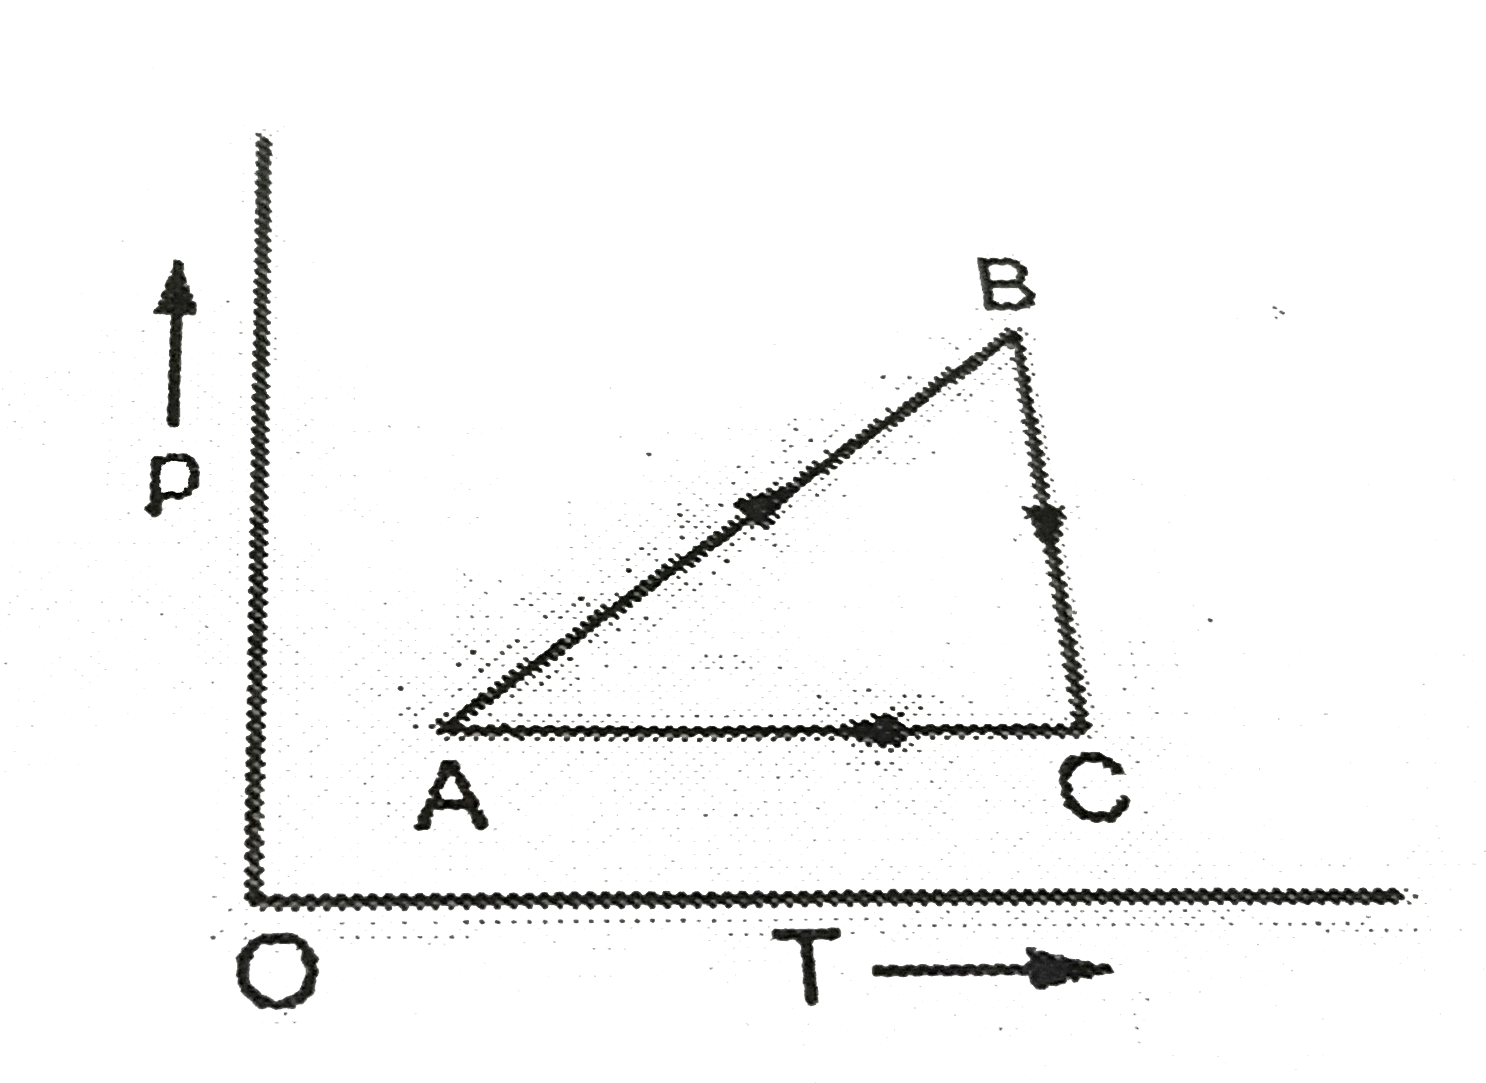
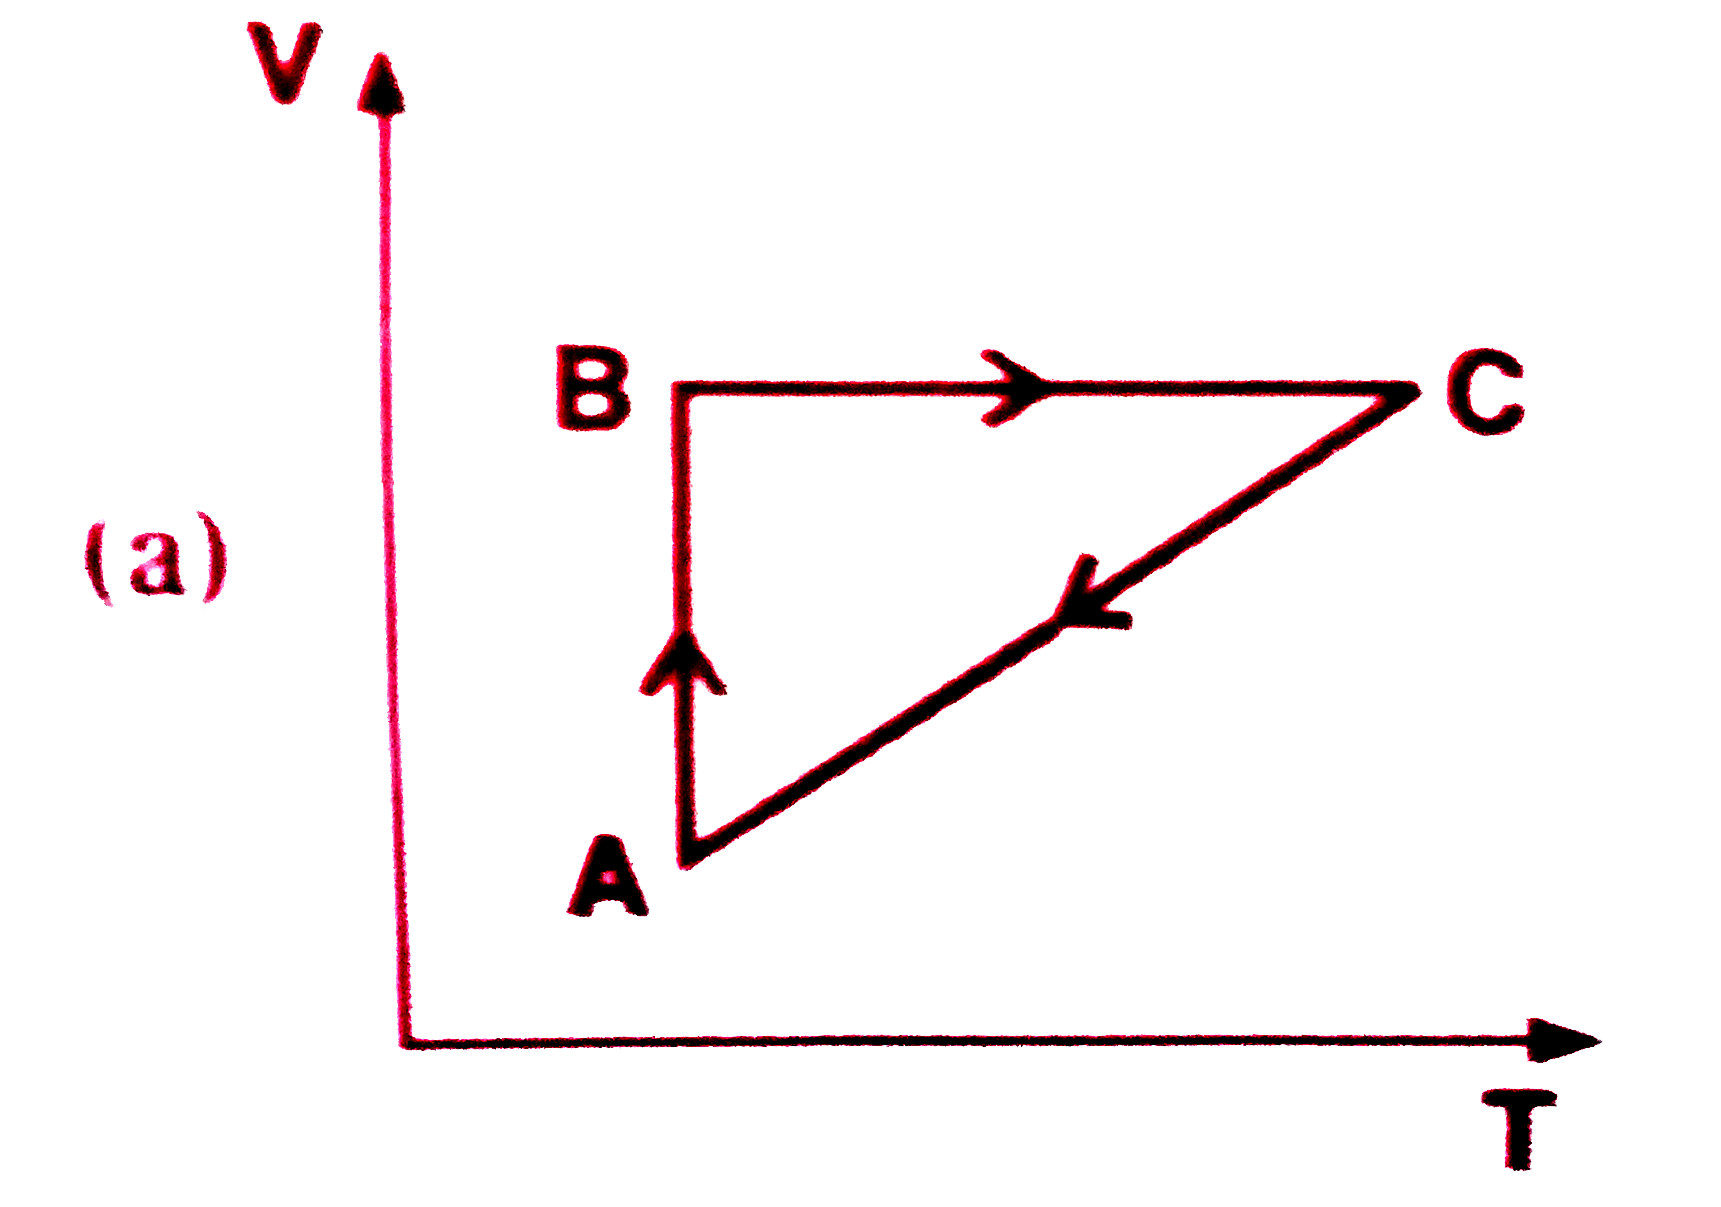
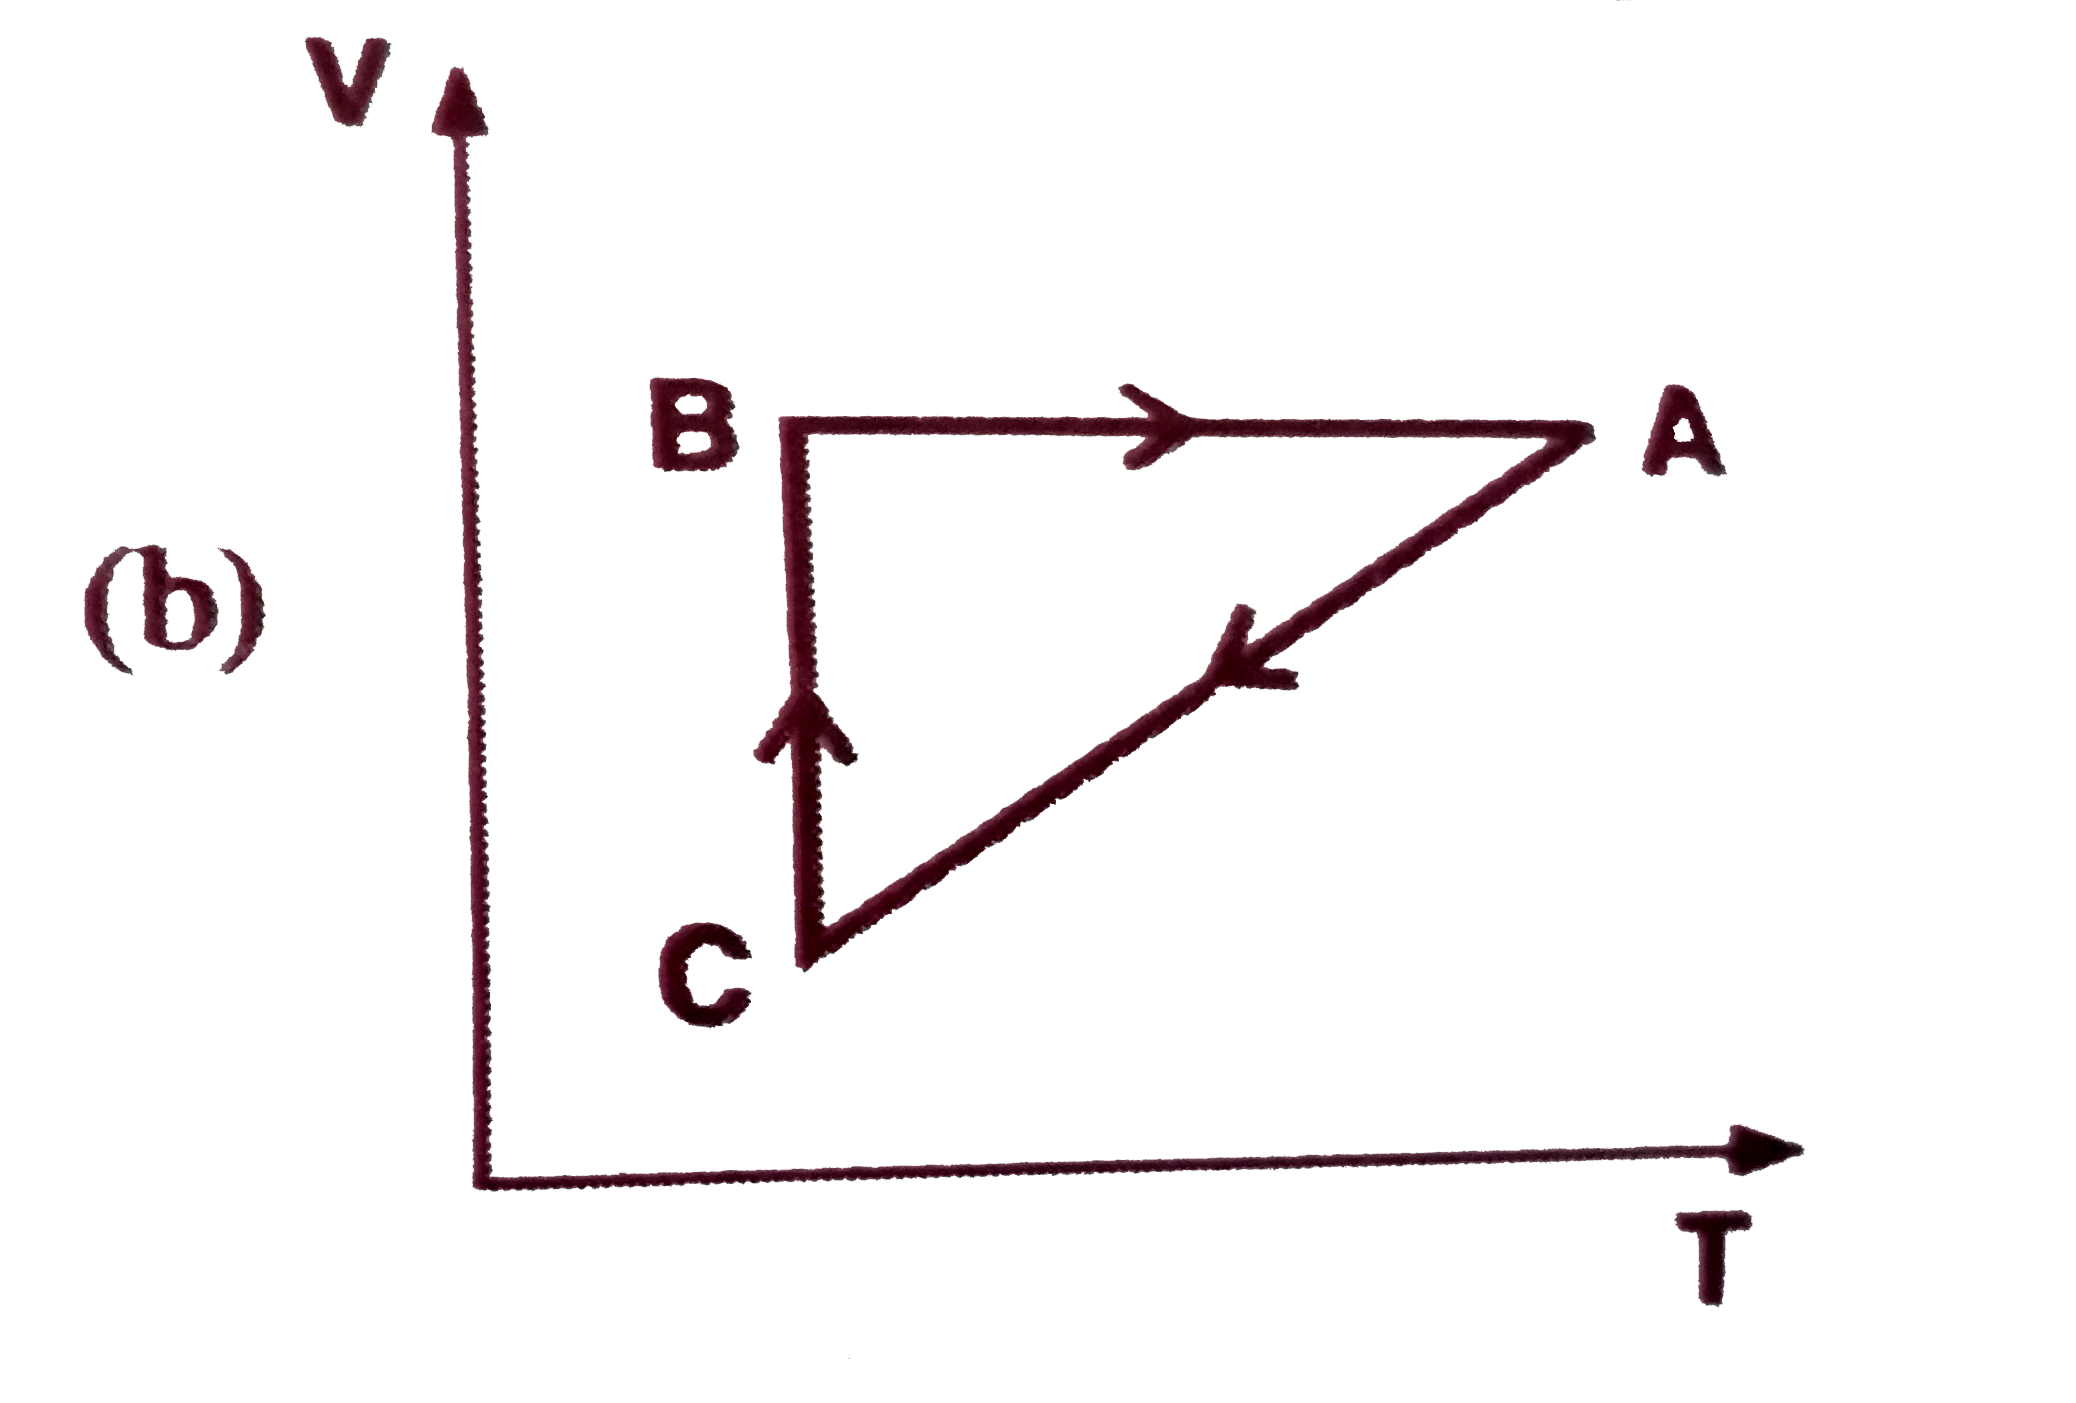
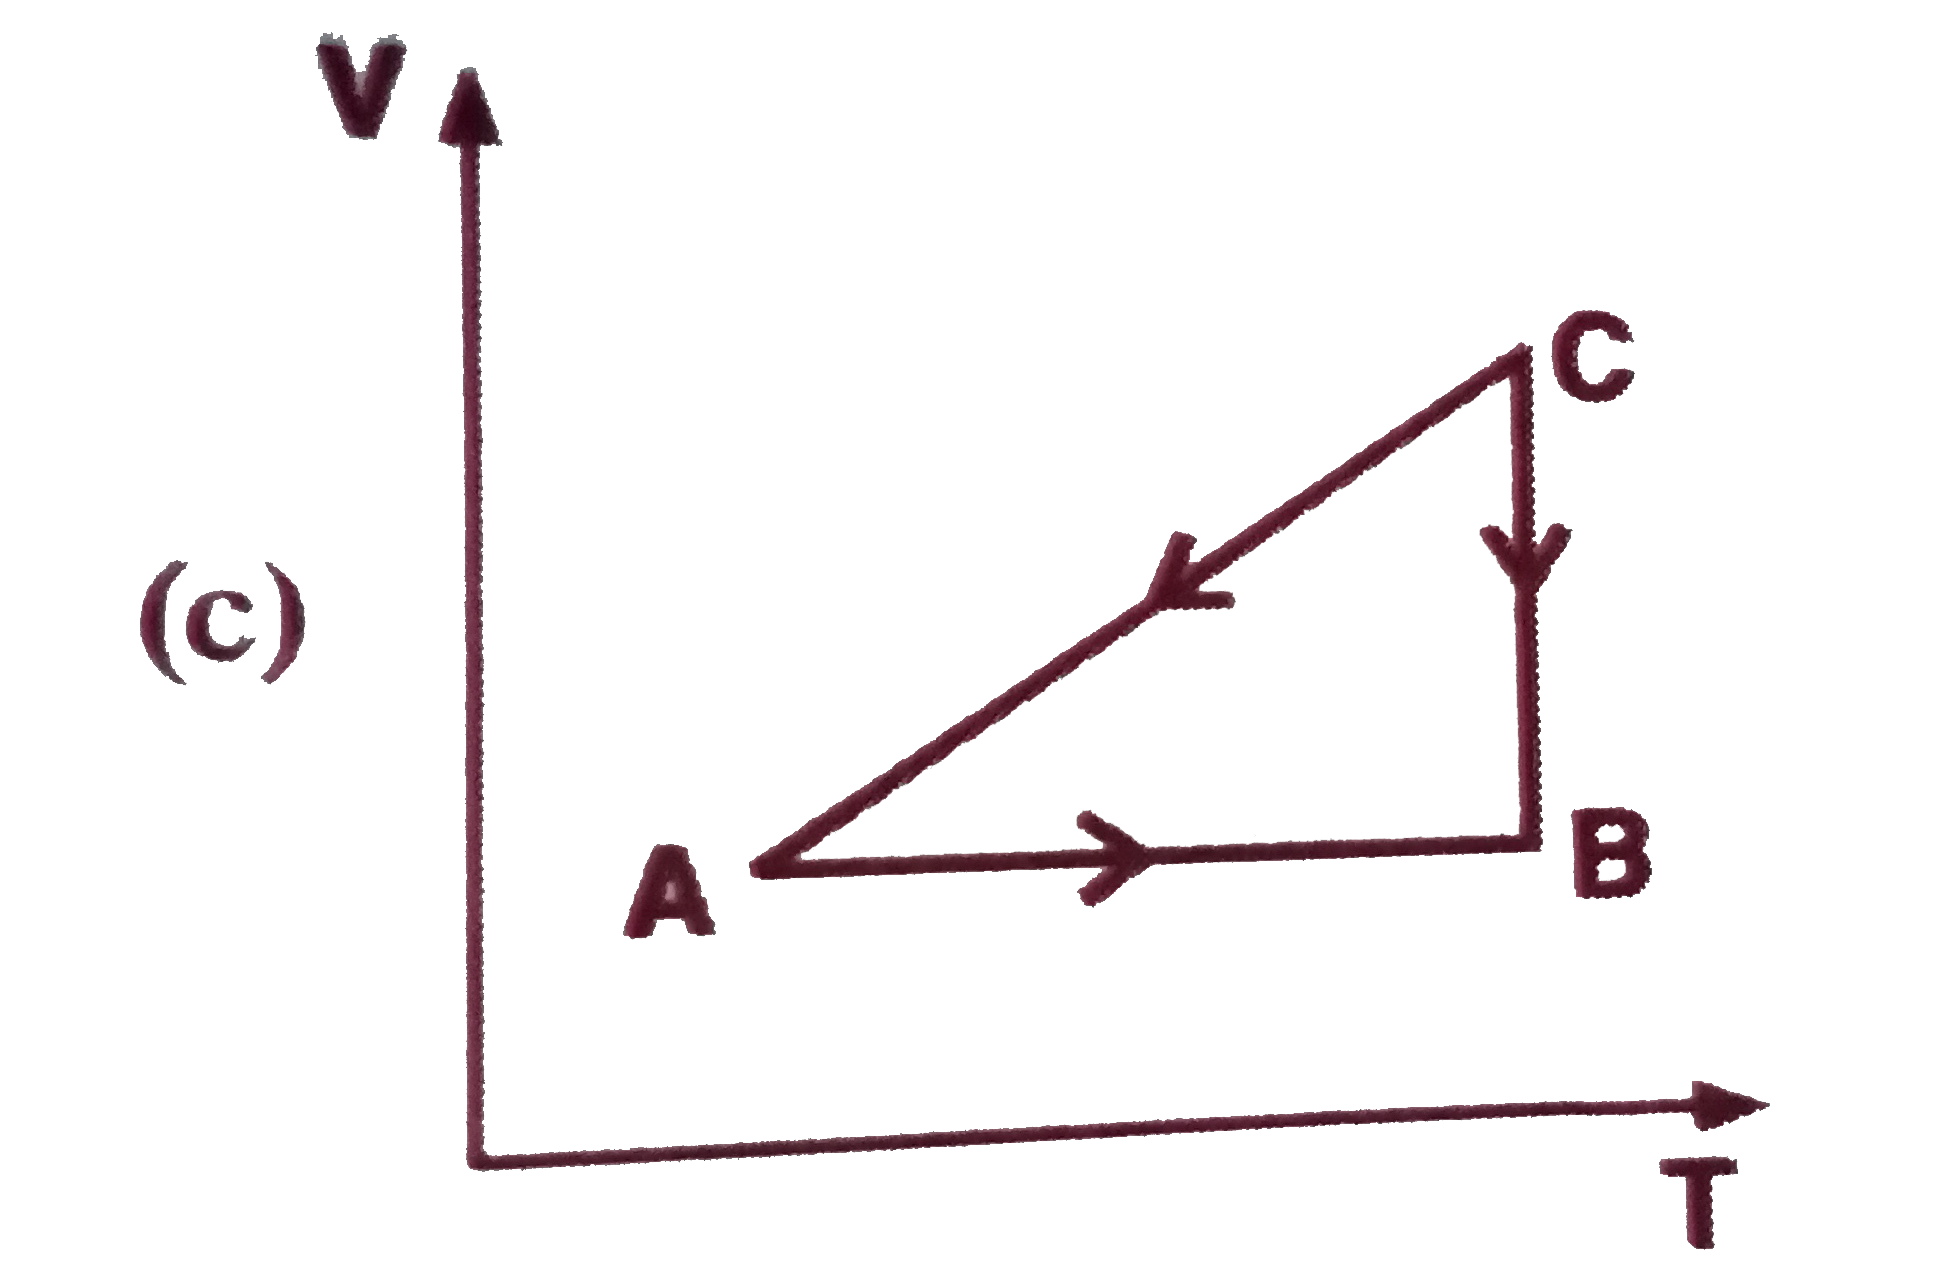
- A cyclic process is shown in the p-T diagram. Which of the curves show...
Text Solution
|
- Heat is supplied to a certain homogeneous sample of matter, at a unifo...
Text Solution
|
- An ideal gas is taken from the state A (pressure P, volume V) to the s...
Text Solution
|
- The radioactive nucleus of an element X decays to a stable nucleus of ...
Text Solution
|
- In photoelectric effect the slope of straight line graph between stopp...
Text Solution
|
- The stopping potential as a function of the frequency of the incident ...
Text Solution
|
- Which of the following is the graph between the frequency (v) of the i...
Text Solution
|
- Which of the following figure represents the variation of particle mom...
Text Solution
|
- The follwing diagram indicates the energy levels of a certain atom whe...
Text Solution
|
- The maximu kinetic energy (E(k)) of the photoelectron varies with freq...
Text Solution
|
- The following graphs illustrate:
Text Solution
|
- In the following graph:
Text Solution
|
- The variation of ^^(m) of acetic acid with concentration is correctly ...
Text Solution
|
- Distribution of molecules with velocity is represented by the curve ...
Text Solution
|
- CH(3)COOH is neutralized by NaOH. Conductometric titration curve will ...
Text Solution
|
- If for a given substance, melting point is T(B) and freezing point is ...
Text Solution
|
- Which of the following represents zero order reaction ?
Text Solution
|
- This graph represents:
Text Solution
|