A
B
C
D
Text Solution
Verified by Experts
The correct Answer is:


Topper's Solved these Questions
Similar Questions
Explore conceptually related problems
OP TANDON-MISCELLANEOUS (TOPICS OF GENERAL INTEREST)-SET-VI: Problems on graphical aptitude
- The stopping potential as a function of the frequency of the incident ...
Text Solution
|
- Which of the following is the graph between the frequency (v) of the i...
Text Solution
|
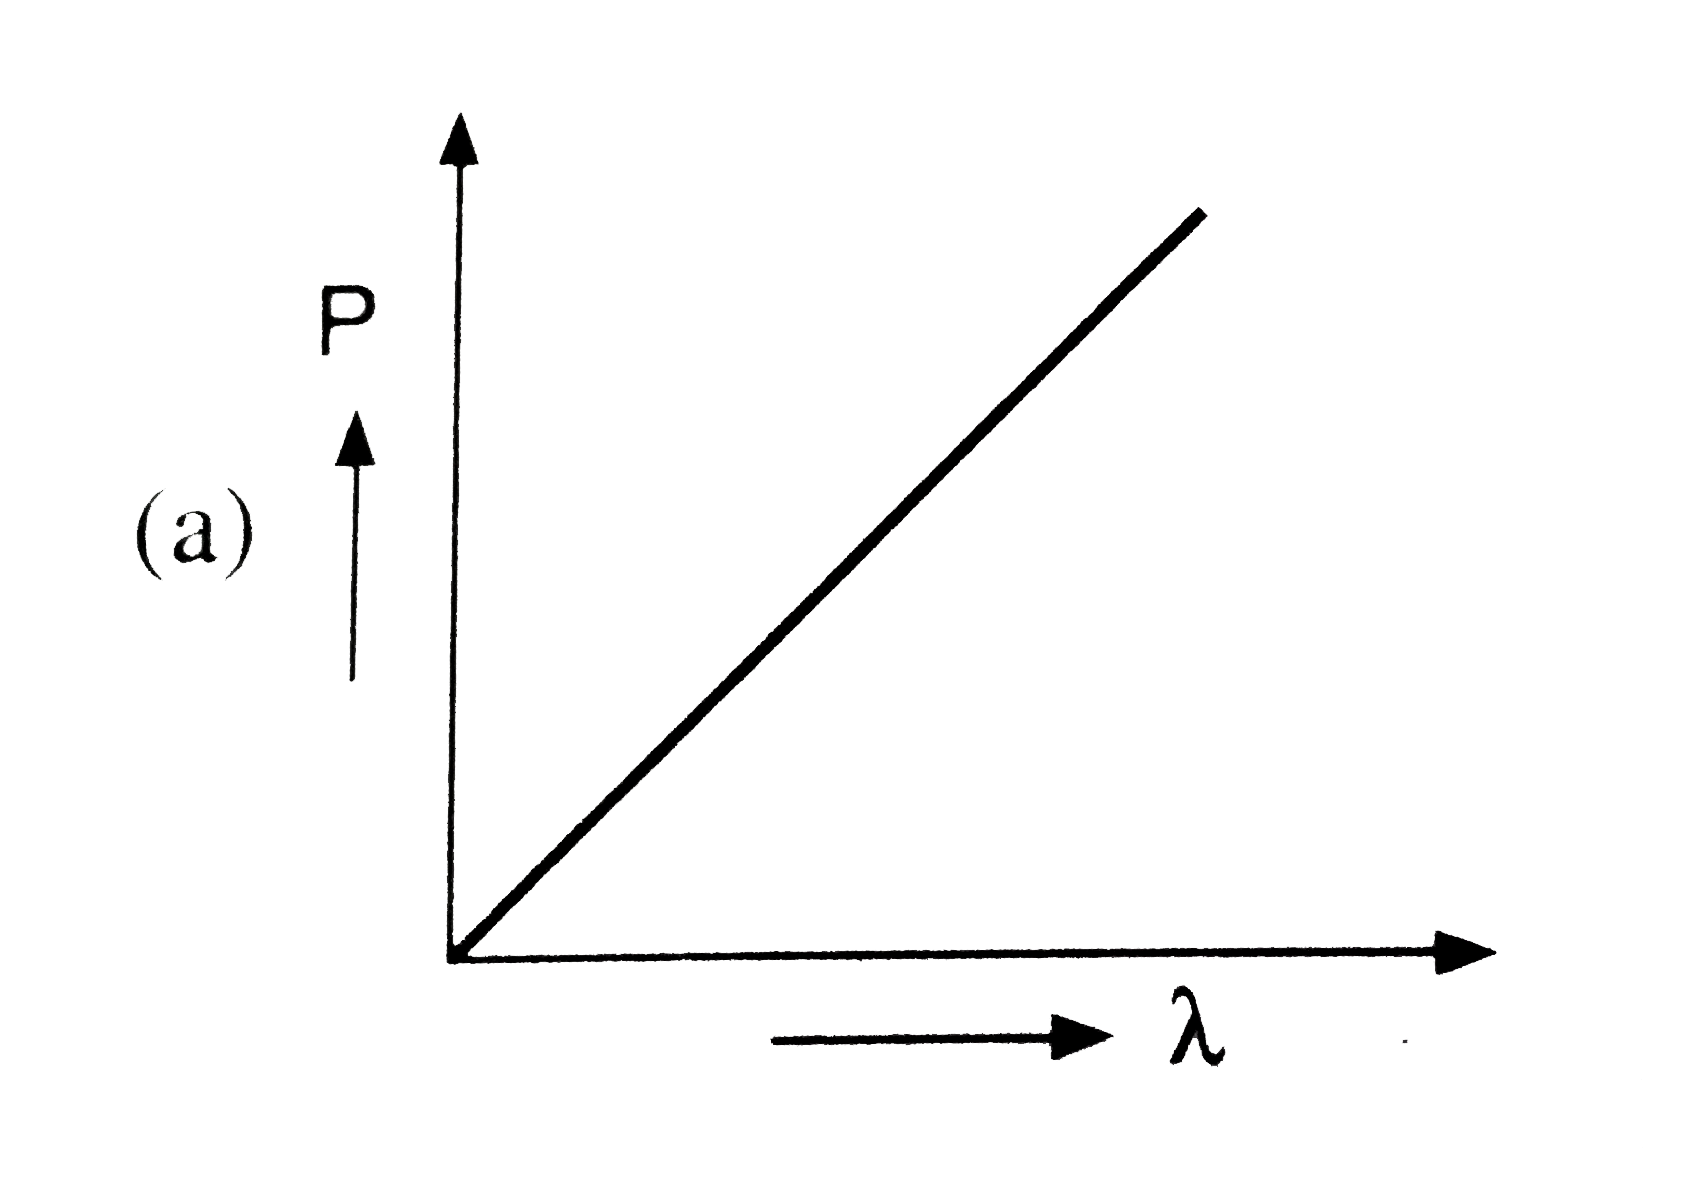
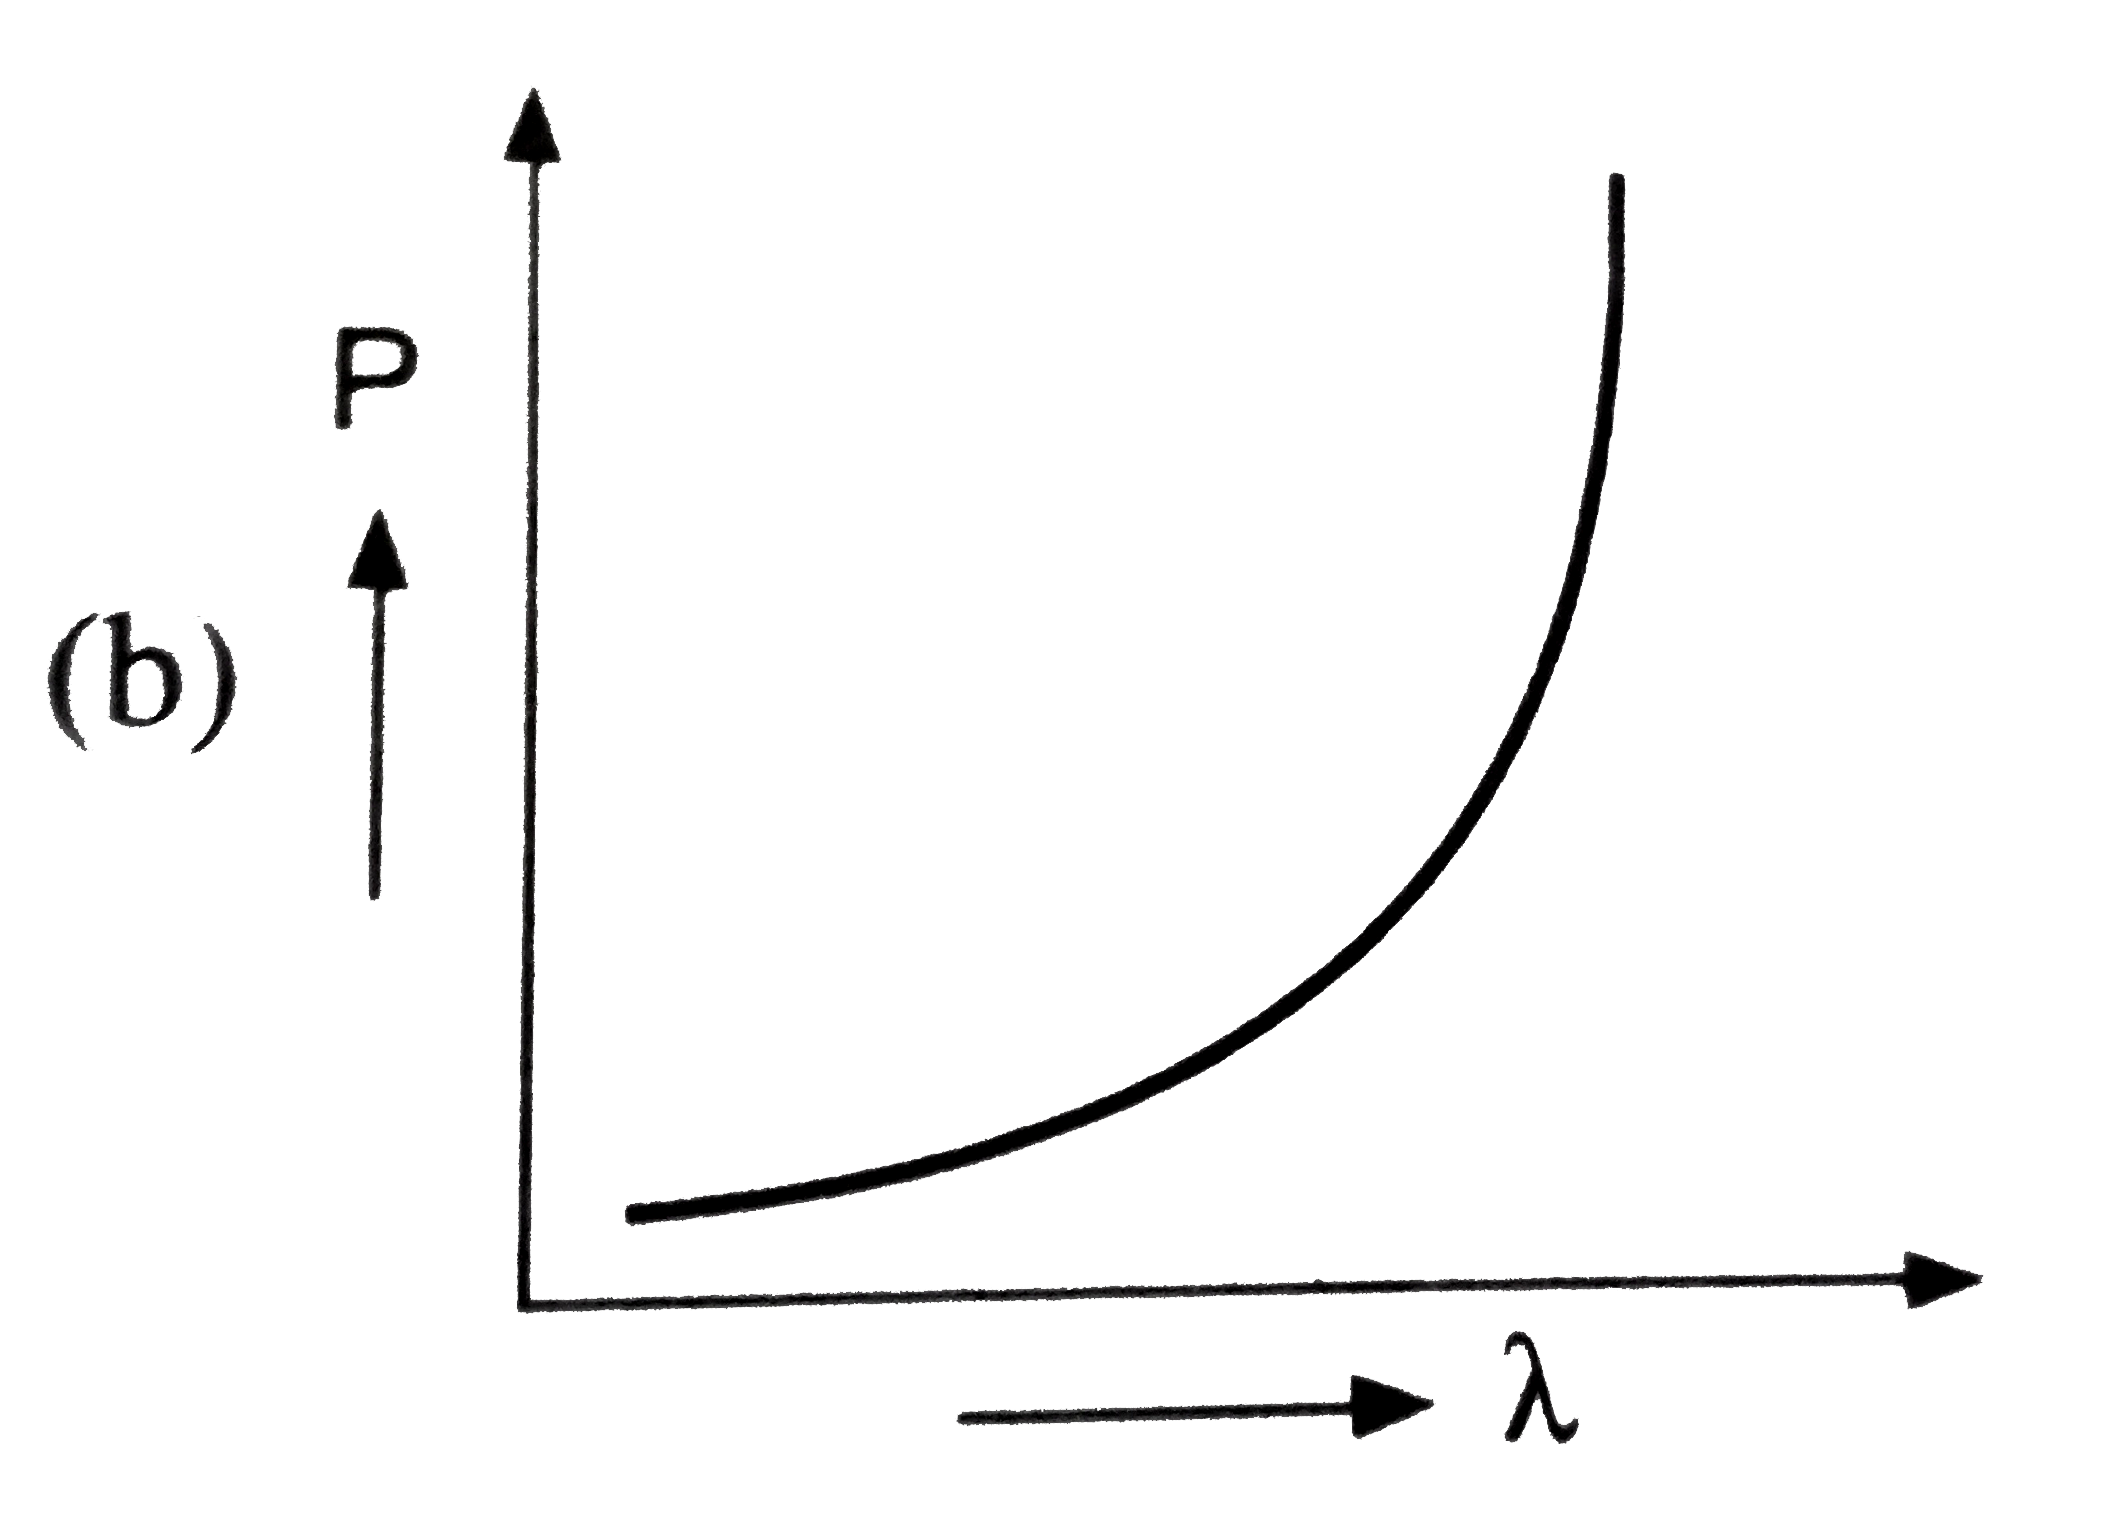
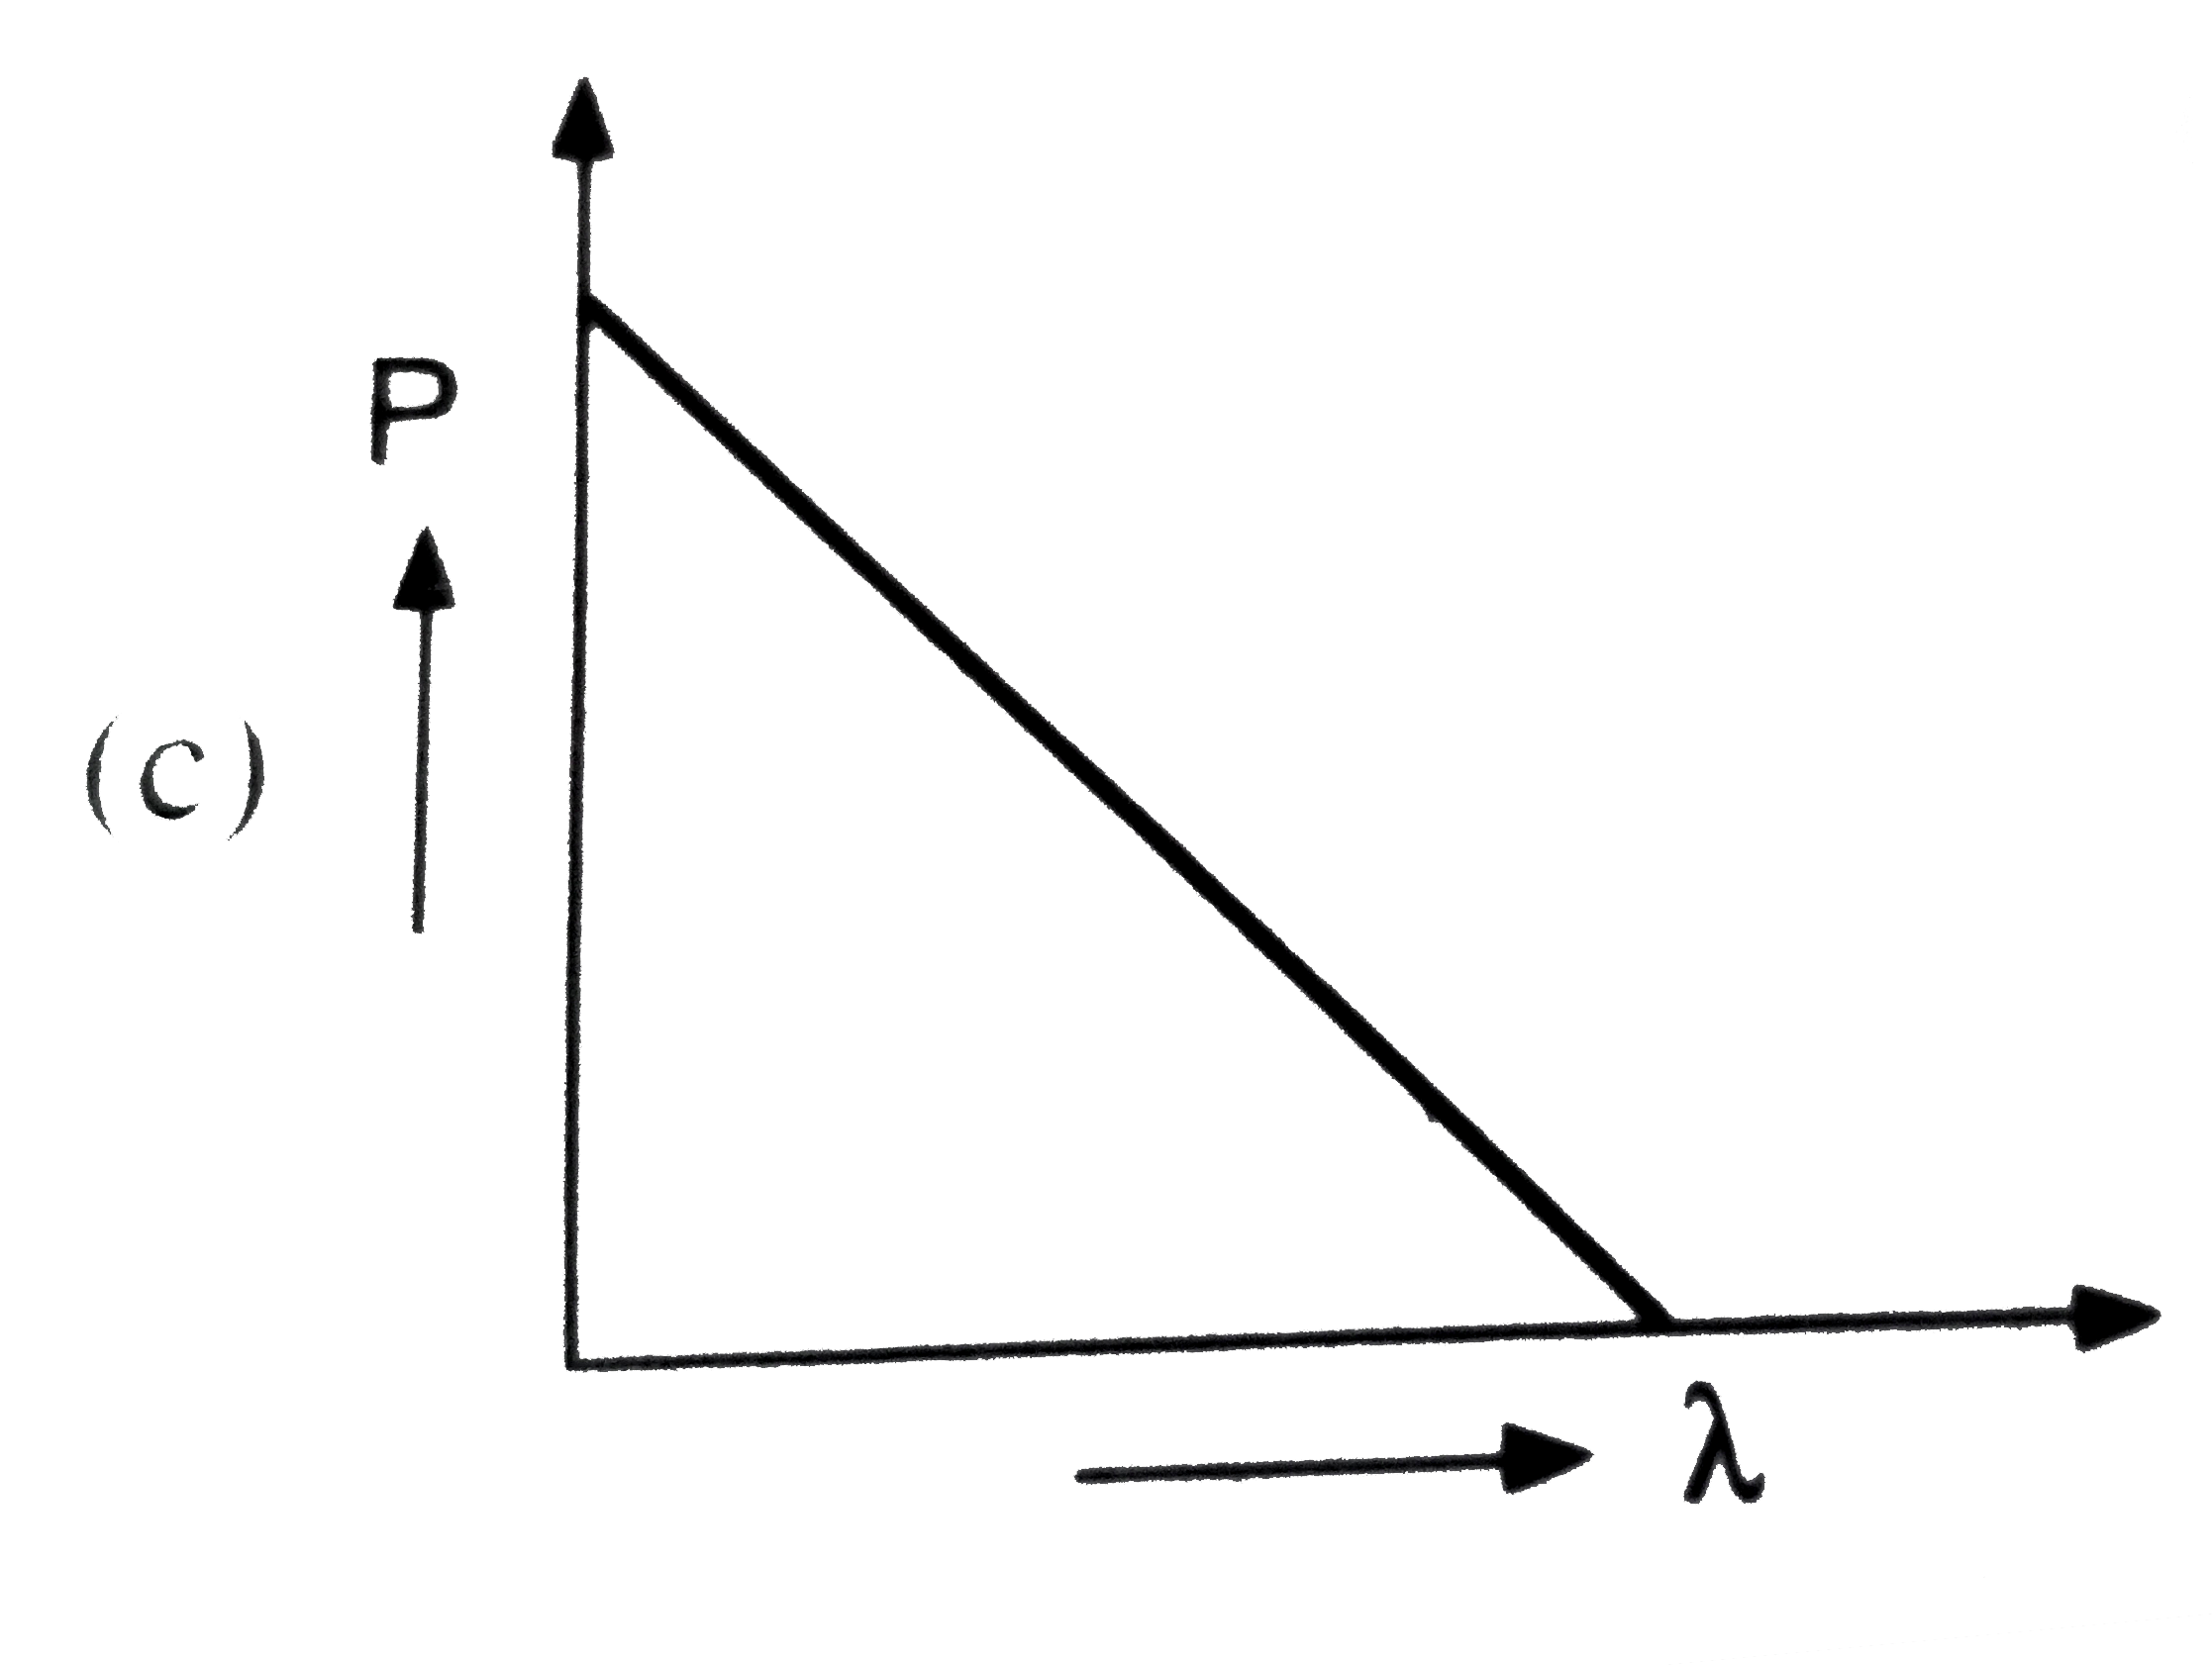
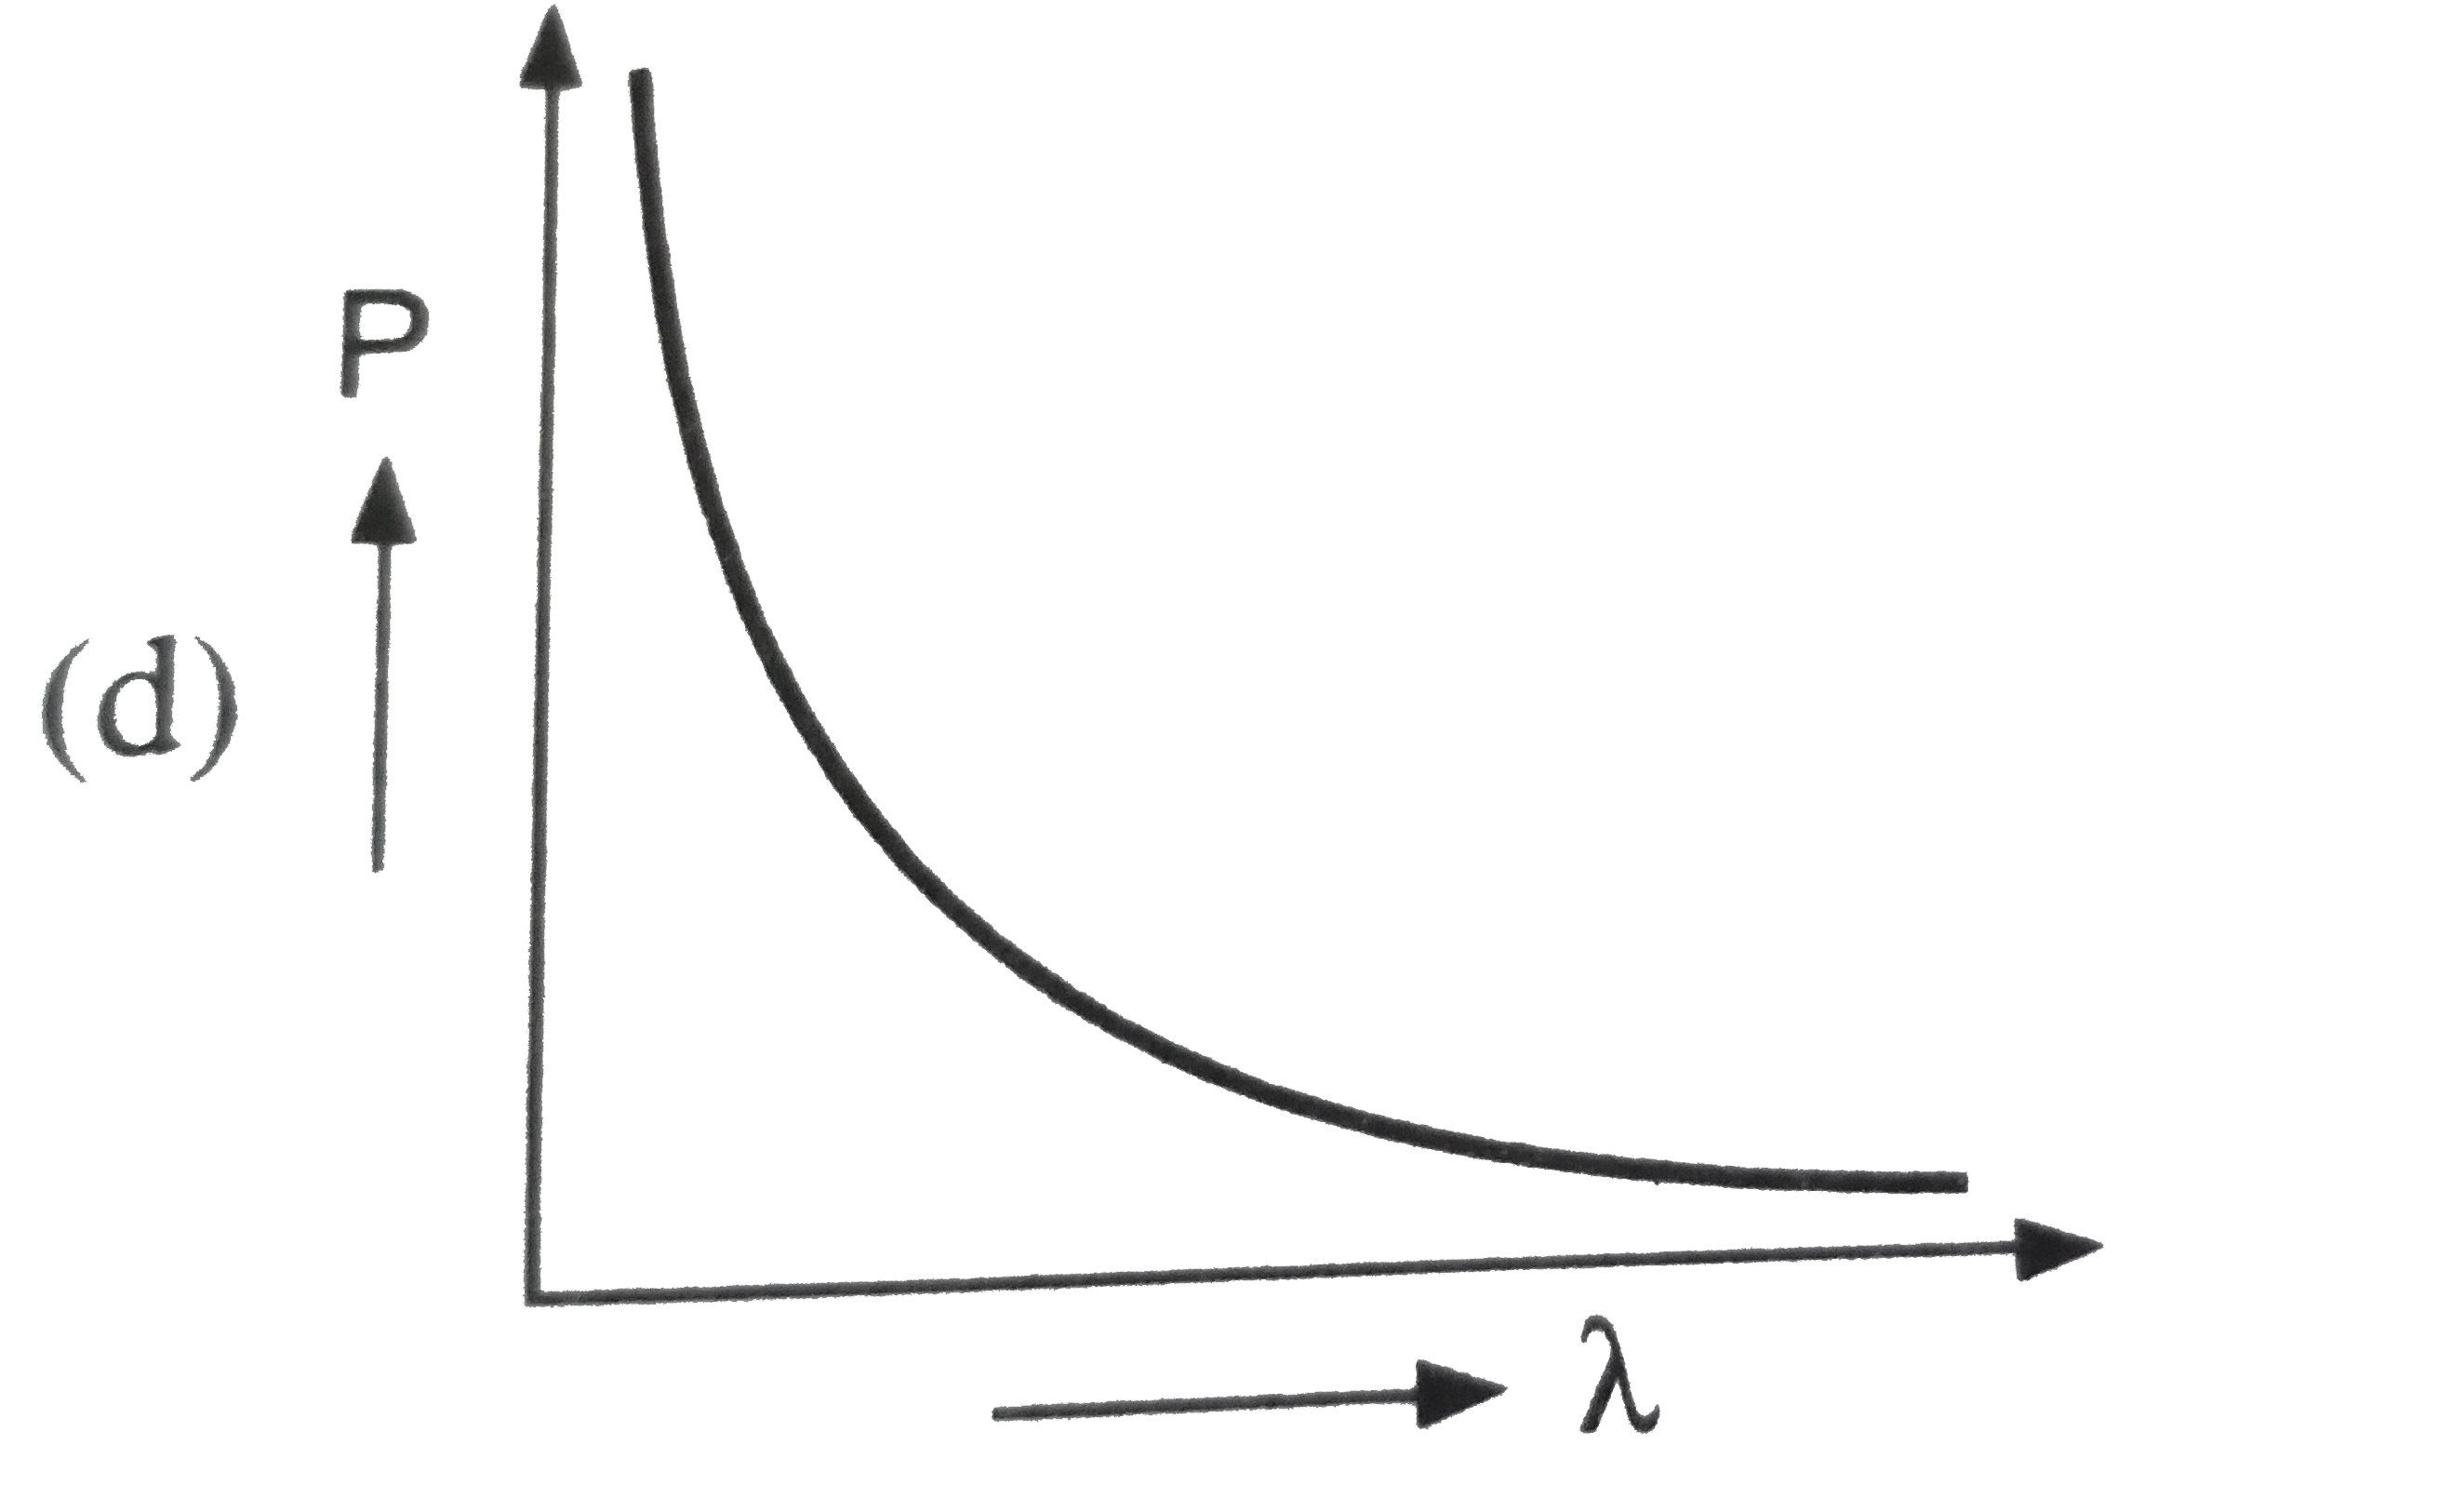
- Which of the following figure represents the variation of particle mom...
Text Solution
|
- The follwing diagram indicates the energy levels of a certain atom whe...
Text Solution
|
- The maximu kinetic energy (E(k)) of the photoelectron varies with freq...
Text Solution
|
- The following graphs illustrate:
Text Solution
|
- In the following graph:
Text Solution
|
- The variation of ^^(m) of acetic acid with concentration is correctly ...
Text Solution
|
- Distribution of molecules with velocity is represented by the curve ...
Text Solution
|
- CH(3)COOH is neutralized by NaOH. Conductometric titration curve will ...
Text Solution
|
- If for a given substance, melting point is T(B) and freezing point is ...
Text Solution
|
- Which of the following represents zero order reaction ?
Text Solution
|
- This graph represents:
Text Solution
|
- The efficiency of the reversible cycle shown in the given figure is
Text Solution
|
- Which of the following curves represents the chemical adsorption ?
Text Solution
|
- Energy of electron varies with atomic number as the following curve/li...
Text Solution
|
- A radioactive sample consists of two distinct species having equal num...
Text Solution
|
- In following isothermal graphs A, B and C at temperatures T(1), T(2) a...
Text Solution
|
- N(2)(g)+3H(2)(g) hArr 2NH(3)(g), DeltaH^(ɵ)=-22.4 kJ The pressure in...
Text Solution
|
- From the given graph, predict the compound which would be most easily...
Text Solution
|