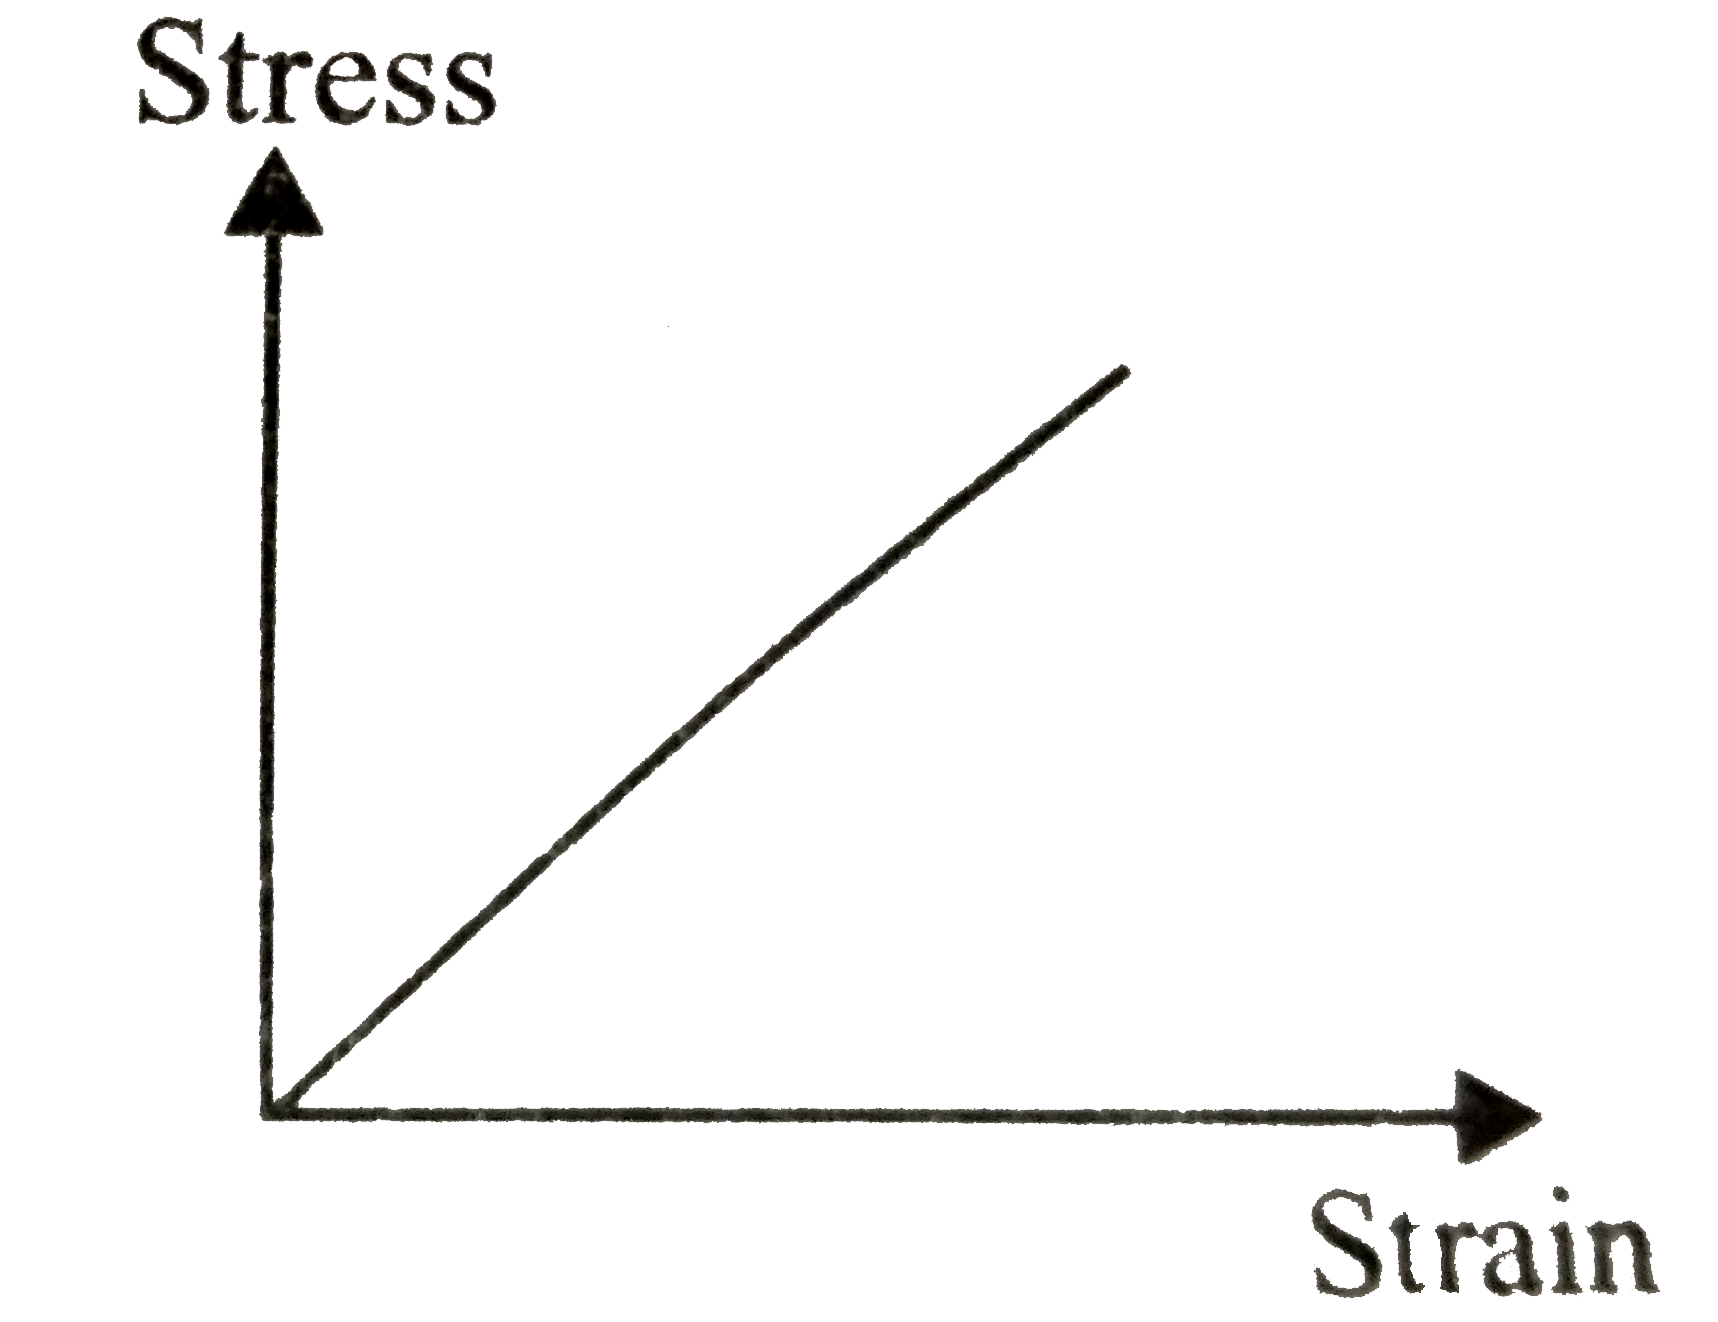
A
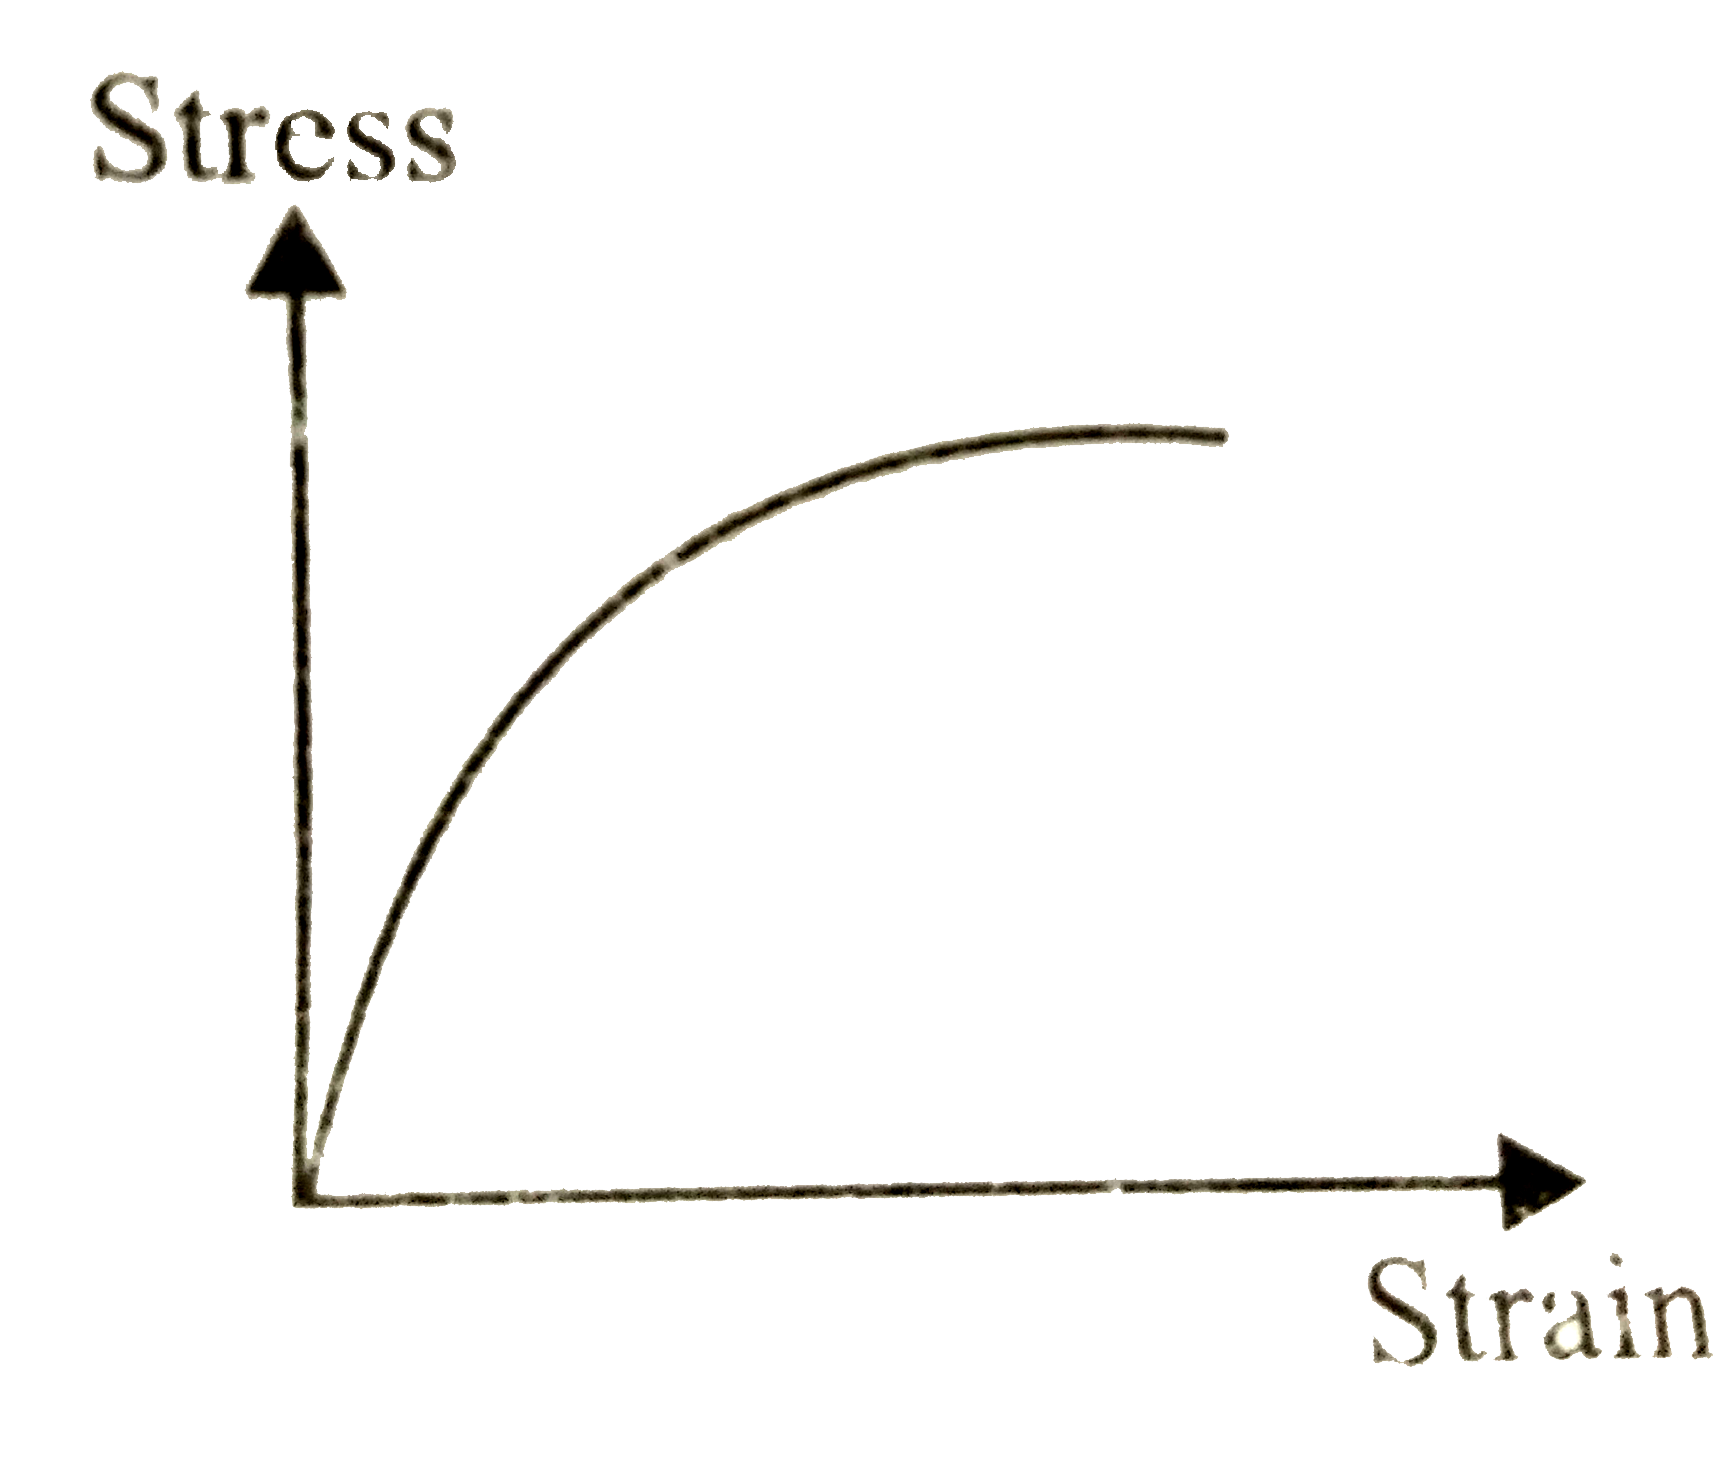
B
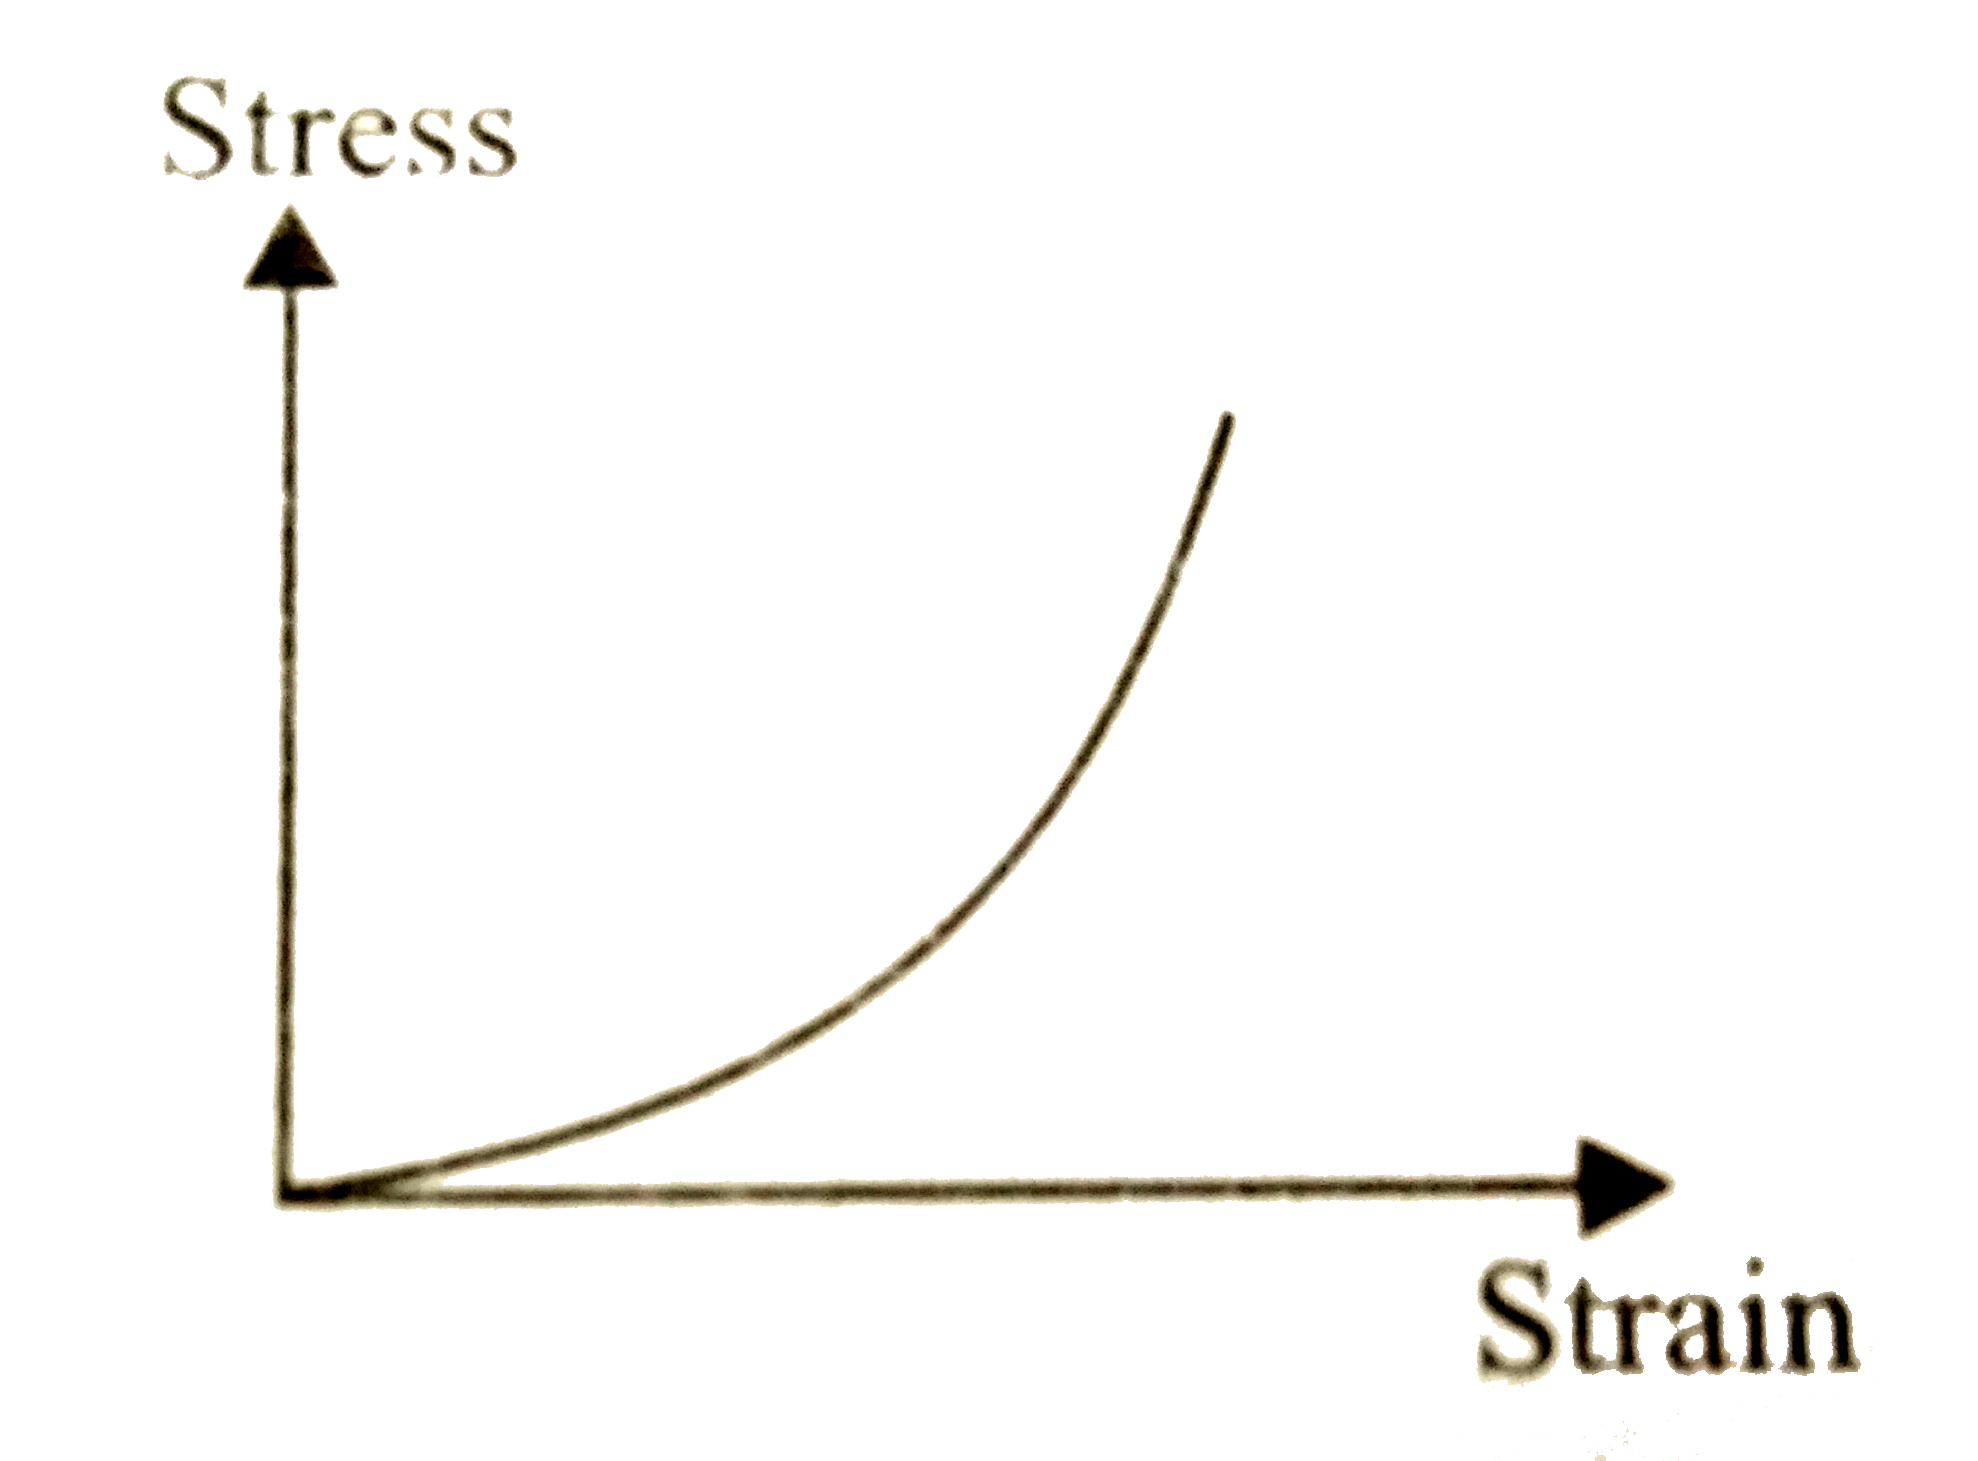
C
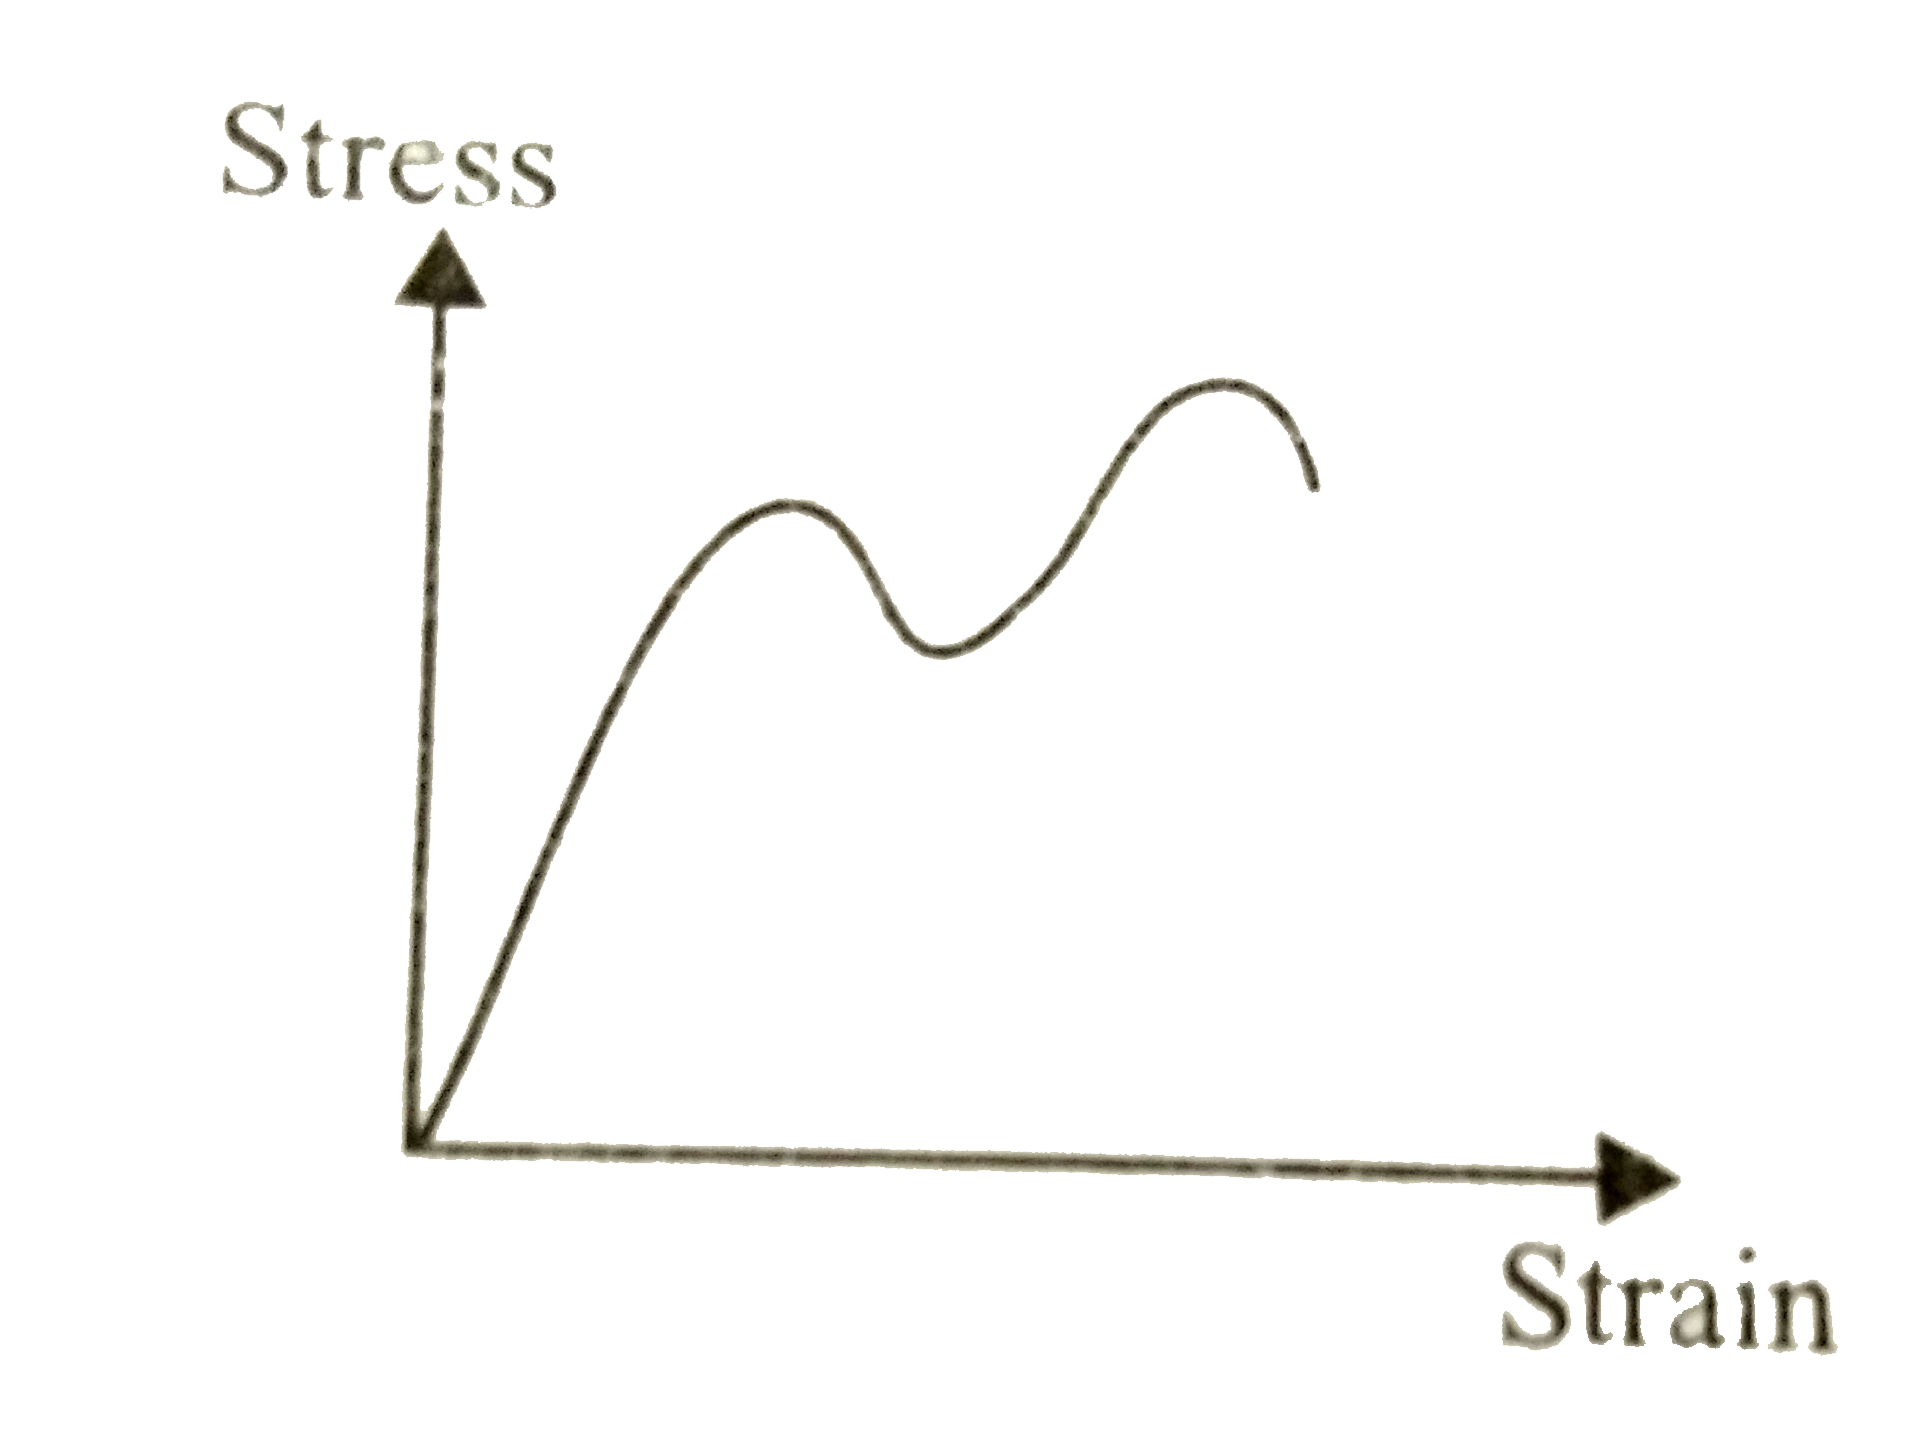
D
Text Solution
Verified by Experts
The correct Answer is:


Topper's Solved these Questions
MECHANICAL PROPERTIES OF SOLIDS
NCERT FINGERTIPS|Exercise Elastic Moduli|69 VideosMECHANICAL PROPERTIES OF SOLIDS
NCERT FINGERTIPS|Exercise Applications Of Elastic Behaviour Of Materials|8 VideosMECHANICAL PROPERTIES OF SOLIDS
NCERT FINGERTIPS|Exercise Hooke'S Law|3 VideosMECHANICAL PROPERTIES OF FLUIDS
NCERT FINGERTIPS|Exercise Assertion And Reason|15 VideosMOTION IN A PLANE
NCERT FINGERTIPS|Exercise Assertion And Reason|15 Videos
Similar Questions
Explore conceptually related problems
NCERT FINGERTIPS-MECHANICAL PROPERTIES OF SOLIDS-Stress-Strain Curve
- Substances which can be stretched to cause large strairs are called
Text Solution
|
- The breaking stress for a wire of unit cross-section is called
Text Solution
|
- Figure shows the strain stress curve for a given material. The Young's...
Text Solution
|
- The stress strain graph for a metal wire is as shown in the figure. In...
Text Solution
|
- Which of the following is the graph showing stress-strain variation f...
Text Solution
|