A
B
C
D
Text Solution
Verified by Experts
The correct Answer is:


Topper's Solved these Questions
Similar Questions
Explore conceptually related problems
NCERT FINGERTIPS-KINETIC THEORY-NCERT Exemplar
- A cubic vessel (with face horizontal + vertical ) contains an ideal ga...
Text Solution
|
- Mole of an ideal gas is contained in a cubical volume V, ABCDEFGH at 3...
Text Solution
|
- Boyle's law is applicable for an
Text Solution
|
- A cylinder containing an ideal gas is in vertical position and has a p...
Text Solution
|
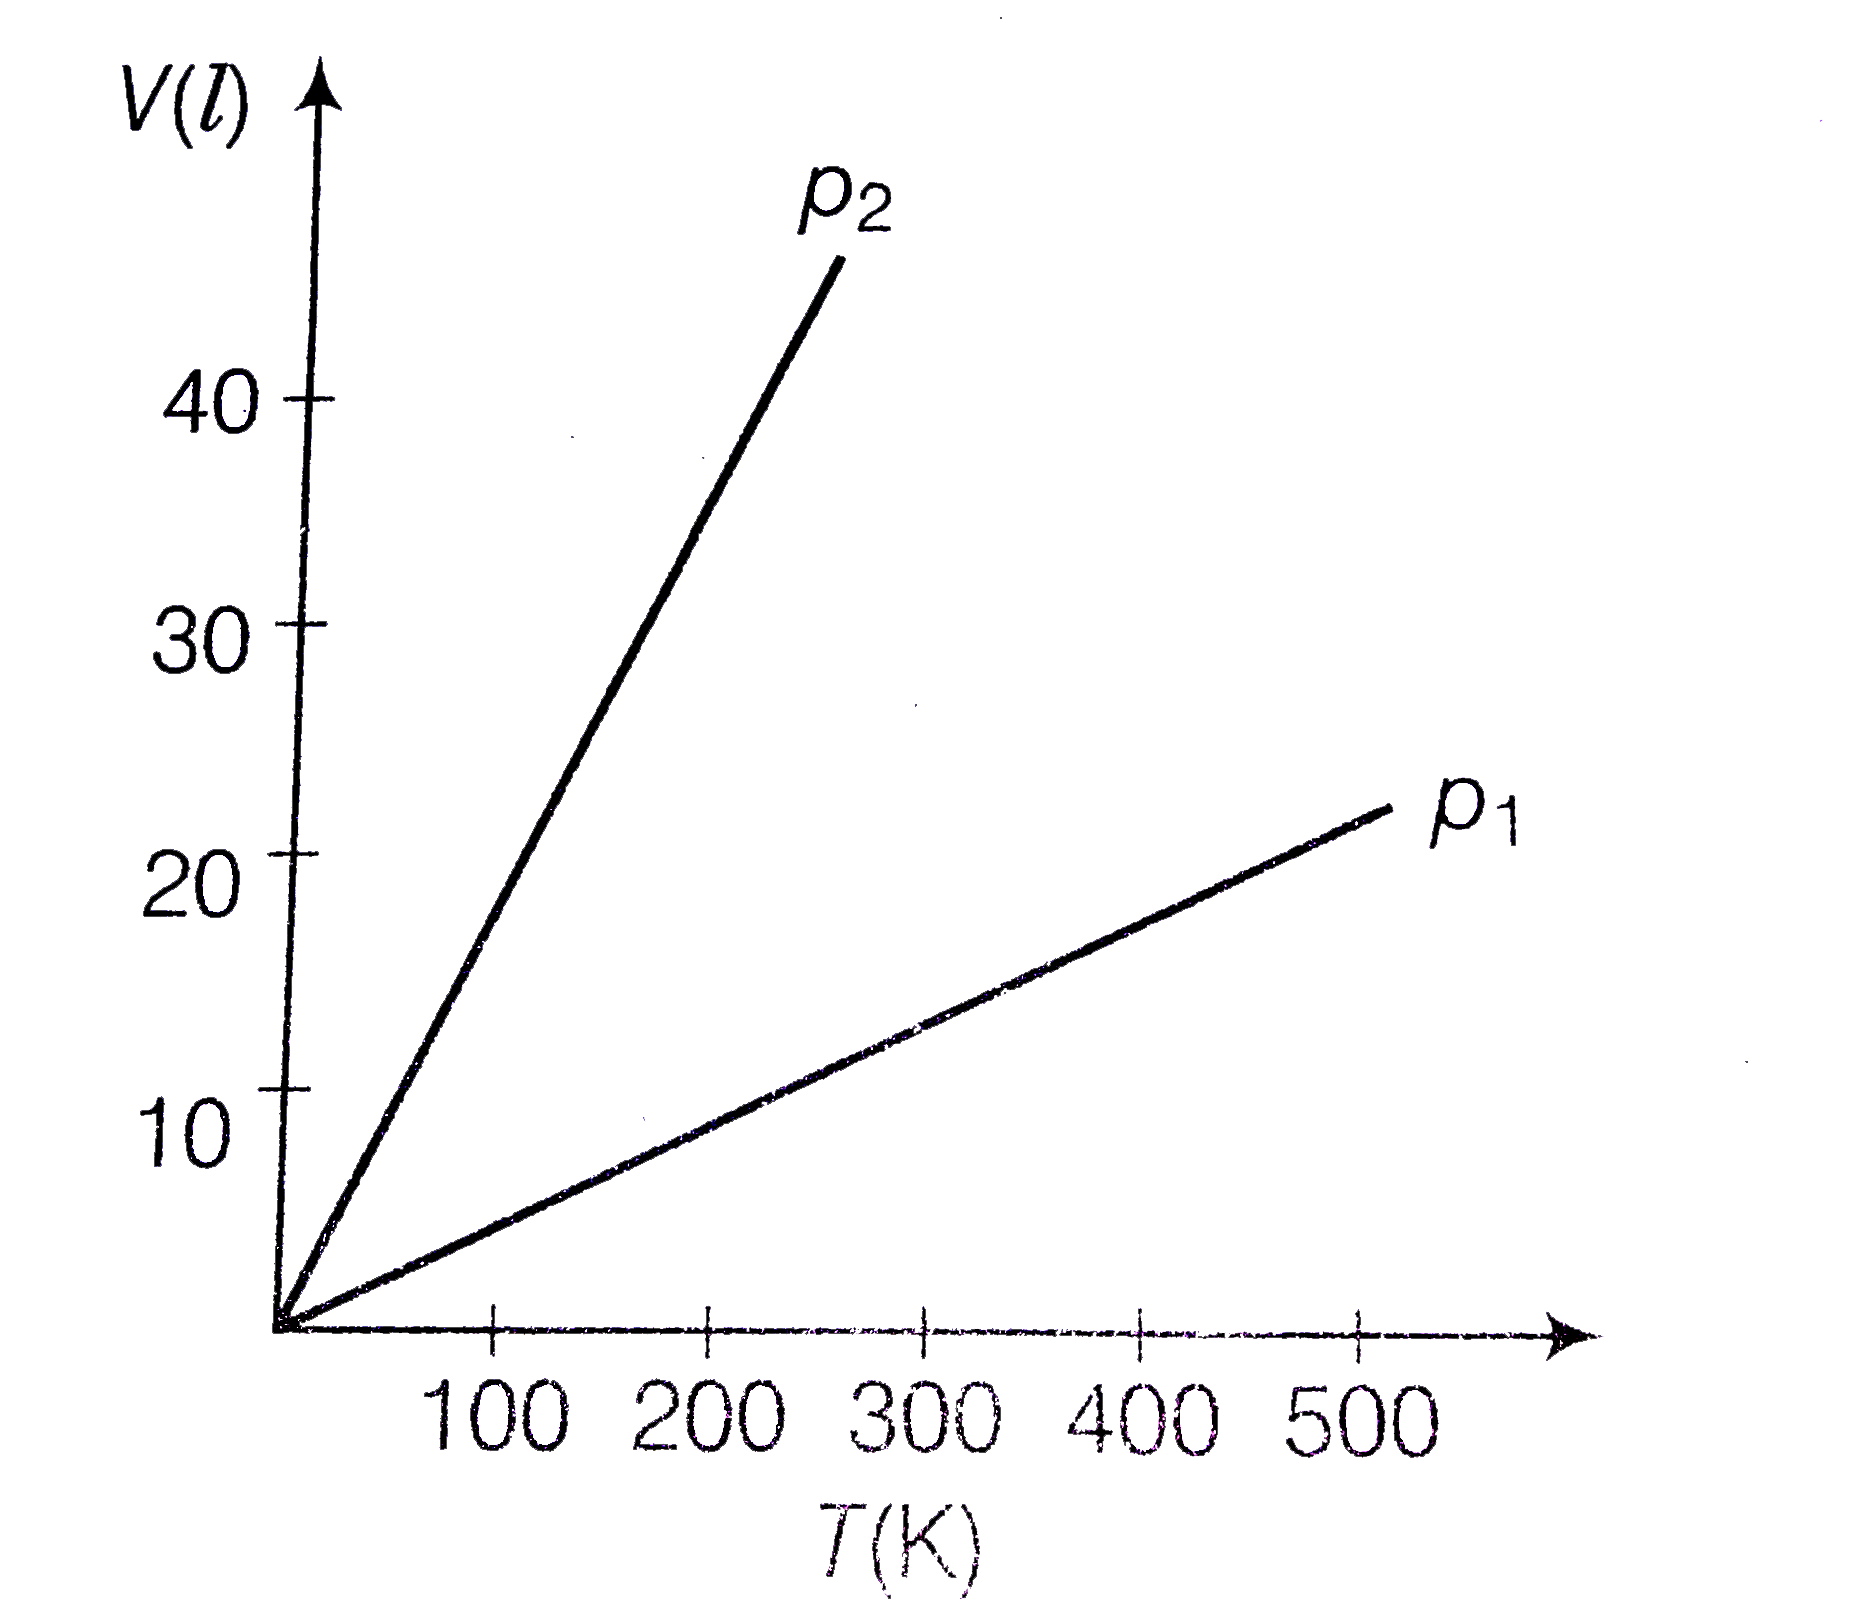
- Volume versus temperature graphs for a given mass of an ideal gas are ...
Text Solution
|
- 1 mole of H(2) gas is contained in box of volume V= 1.00 m^(3) at T = ...
Text Solution
|
- A vessel of volume V contains a mixture of 1 mole of hydrogen and 1 mo...
Text Solution
|
- An inflated rubber balloon contains one mole of an ideal gas has a pre...
Text Solution
|