Text Solution
Verified by Experts


Topper's Solved these Questions
Similar Questions
Explore conceptually related problems
RADHA BHUGANA-THEORY OF DEMAND-UNSOLVED NUMERICALS
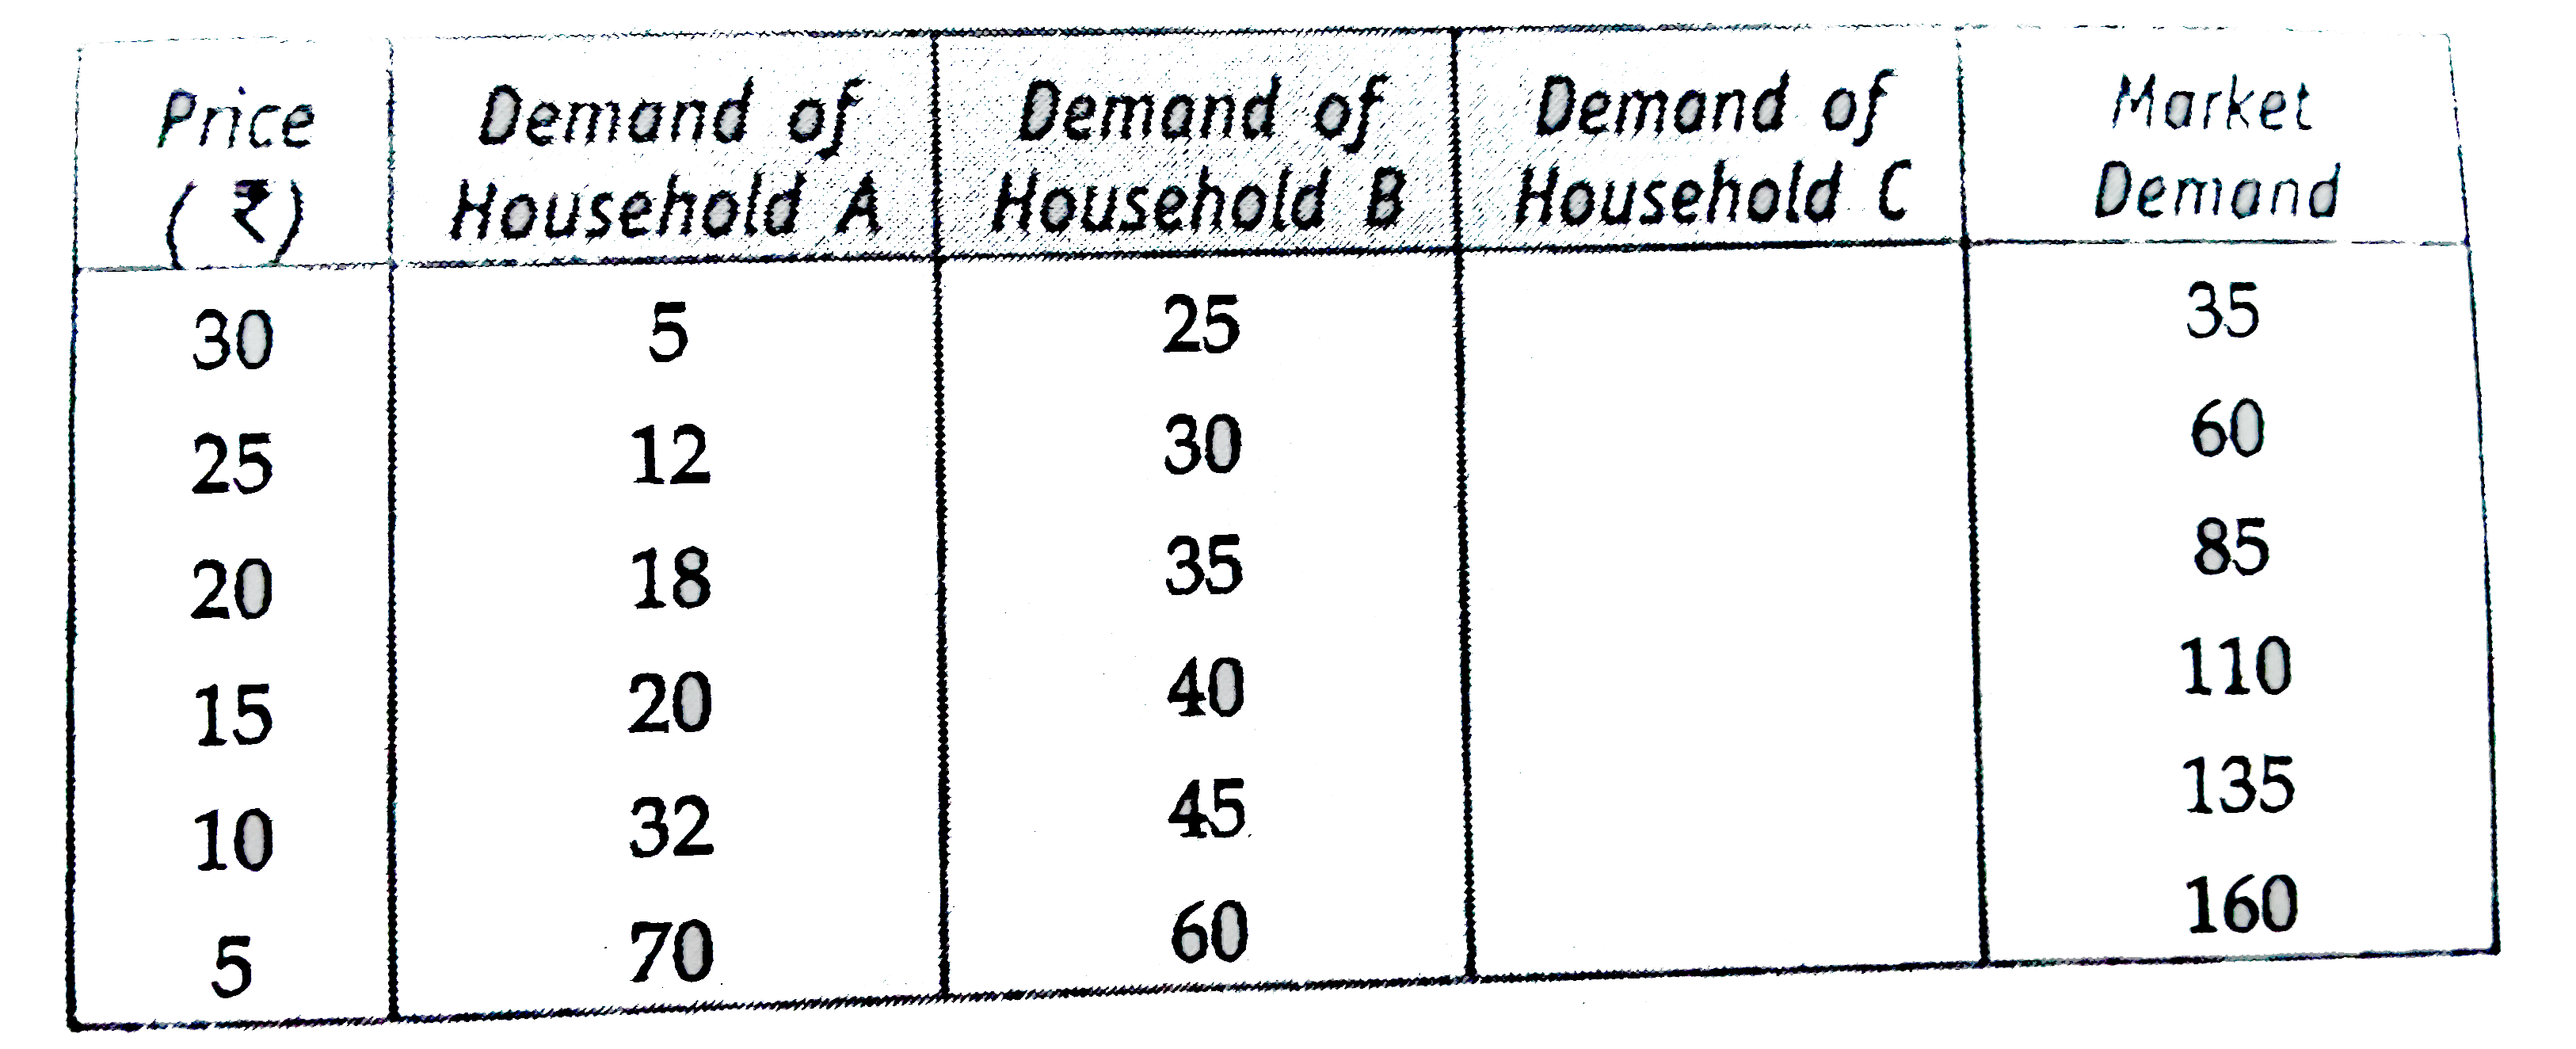
- Calculate market demand from the following :
Text Solution
|
- Three households A, B and C form the demand schedule for the market an...
Text Solution
|
- Identify the following as extension, contraction, increase or decrease...
Text Solution
|
- Demand function of the good X is D(X)=60-10P. Find out the price of X ...
Text Solution
|
- The demand function of a good is Q(d) = 600-25P. Find out the level of...
Text Solution
|
- What is the slope of demand function : Q(d)=100-7P?
Text Solution
|
- Let there be two consumers A and B in the market for a good. Their dem...
Text Solution
|