Identify the different output levels which mark the different phases of the operation of the law of variable proportions from the following data: |{:("Units of Varible Input","Total Product (units)"),(" 0"," 0"),(" 1"," 50"),(" 2"," 20"),(" 3"," 28"),(" 4"," 20"),(" 5"," 30"):}|
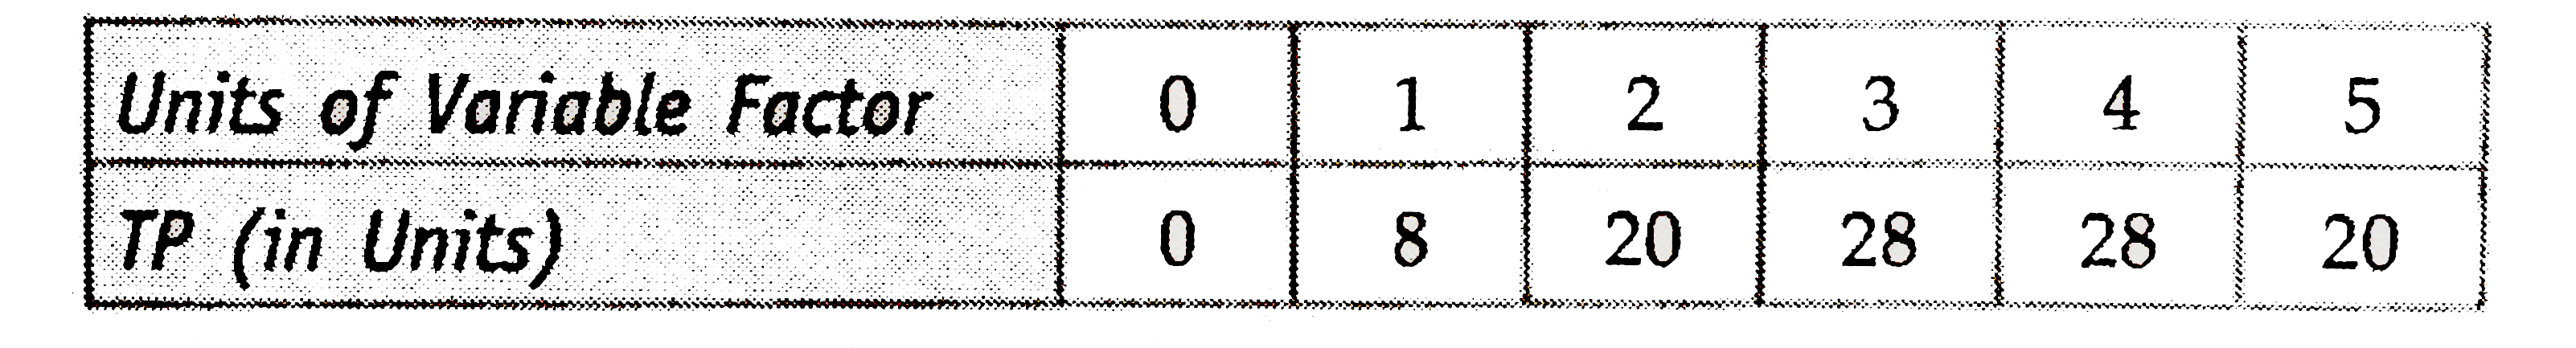
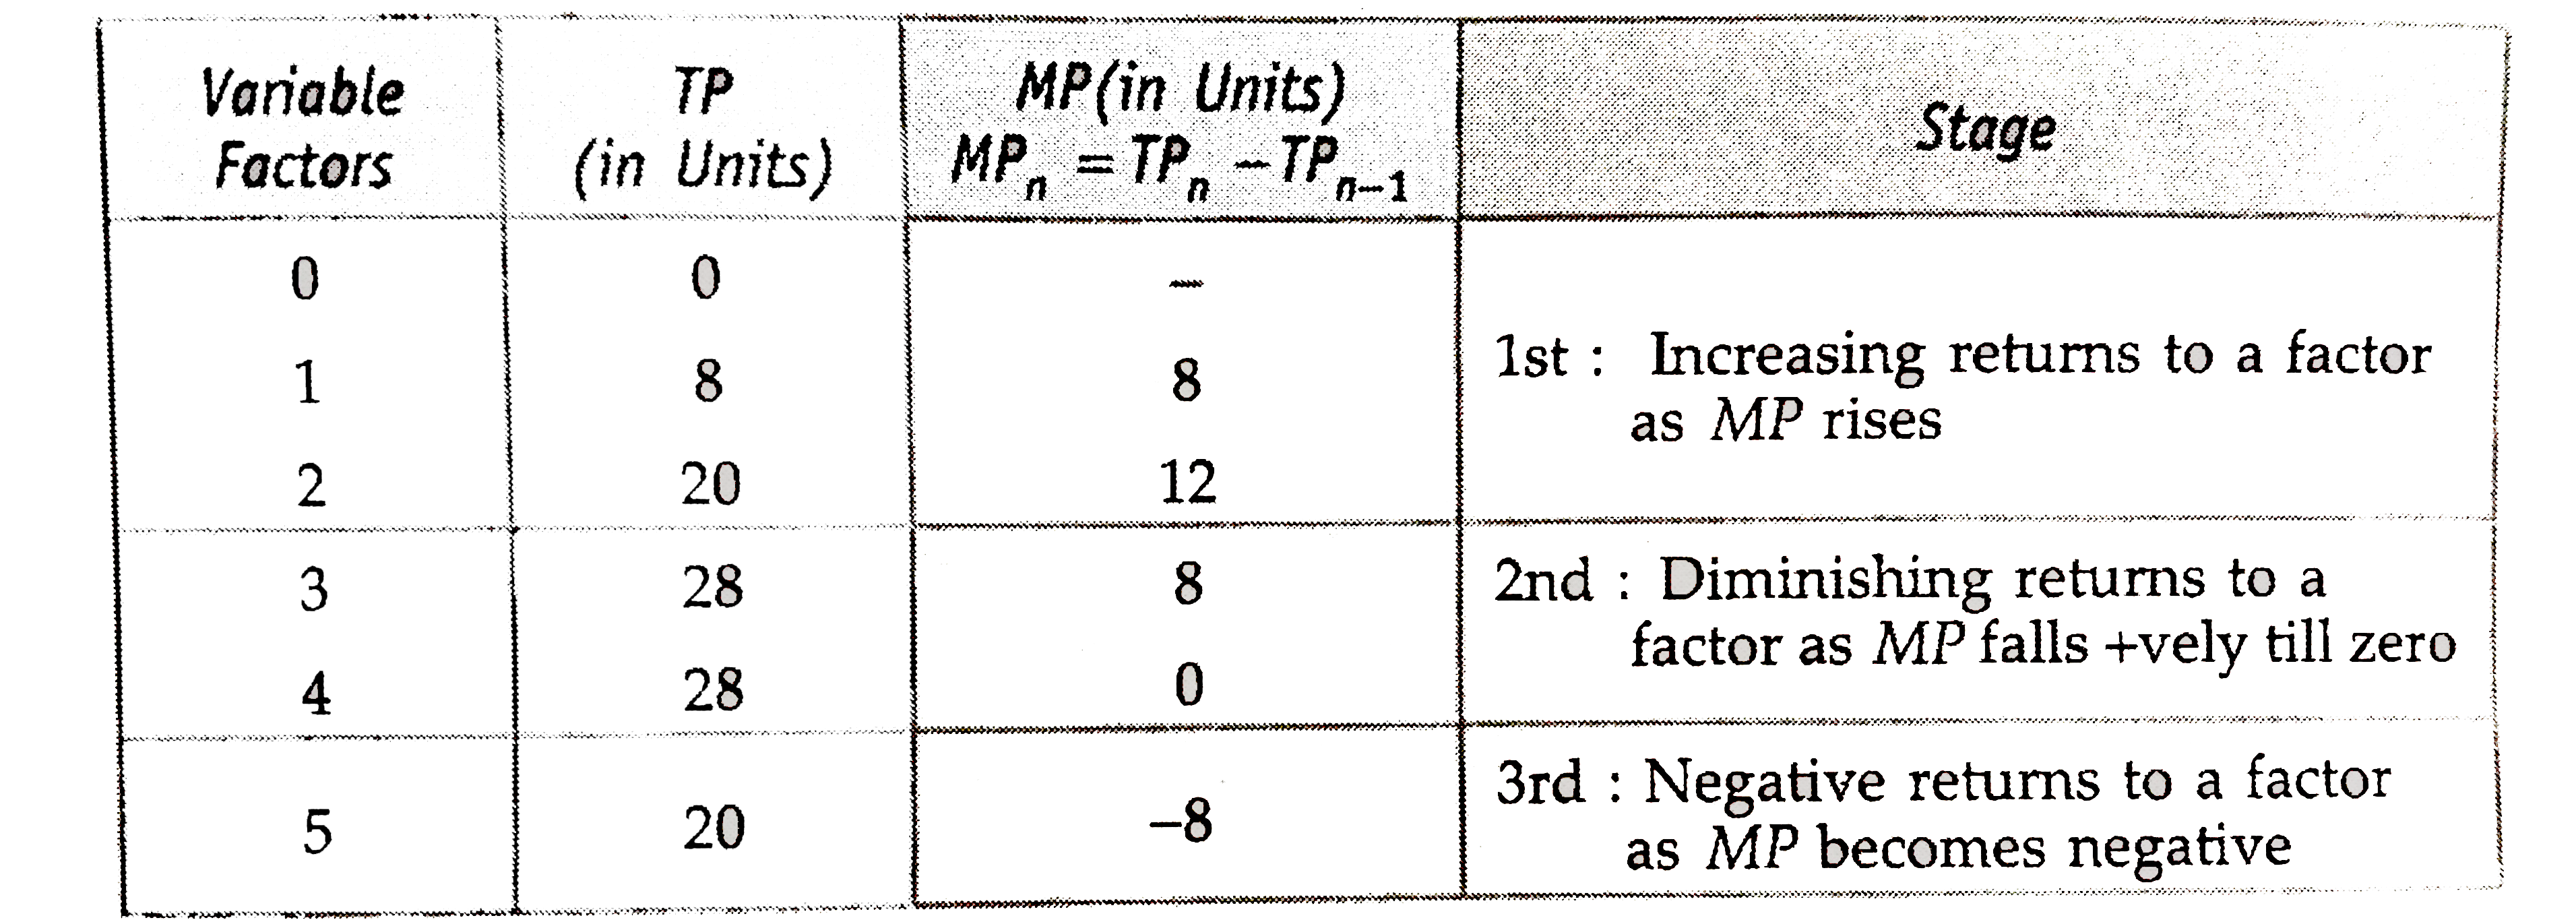
Identify the three phases of the law of variable proportions from the following and also give reason behind each phase.
Calculate the average marks from the following table :
State different phases of the law of variable proportions on the basis of TP. Use diagram.
RADHA BHUGANA-PRODUCER BEHAVIOUR AND SUPPLY-LET US RECAPITULATE