Text Solution
Verified by Experts


Topper's Solved these Questions
PRODUCER'S EQUILIBRIUM
RADHA BHUGANA|Exercise Let Us Recapitulate|4 VideosPRODUCER'S EQUILIBRIUM
RADHA BHUGANA|Exercise MULTIPLE CHOICE QUESTIONS|8 VideosPRODUCER BEHAVIOUR AND SUPPLY
RADHA BHUGANA|Exercise LET US RECAPITULATE|1 VideosSIMPLE APPLICATIONS OF TOOLS OF DEMAND AND SUPPLY
RADHA BHUGANA|Exercise Long answer|3 Videos
Similar Questions
Explore conceptually related problems
RADHA BHUGANA-PRODUCER'S EQUILIBRIUM-UNSOLVED NUMERICALS
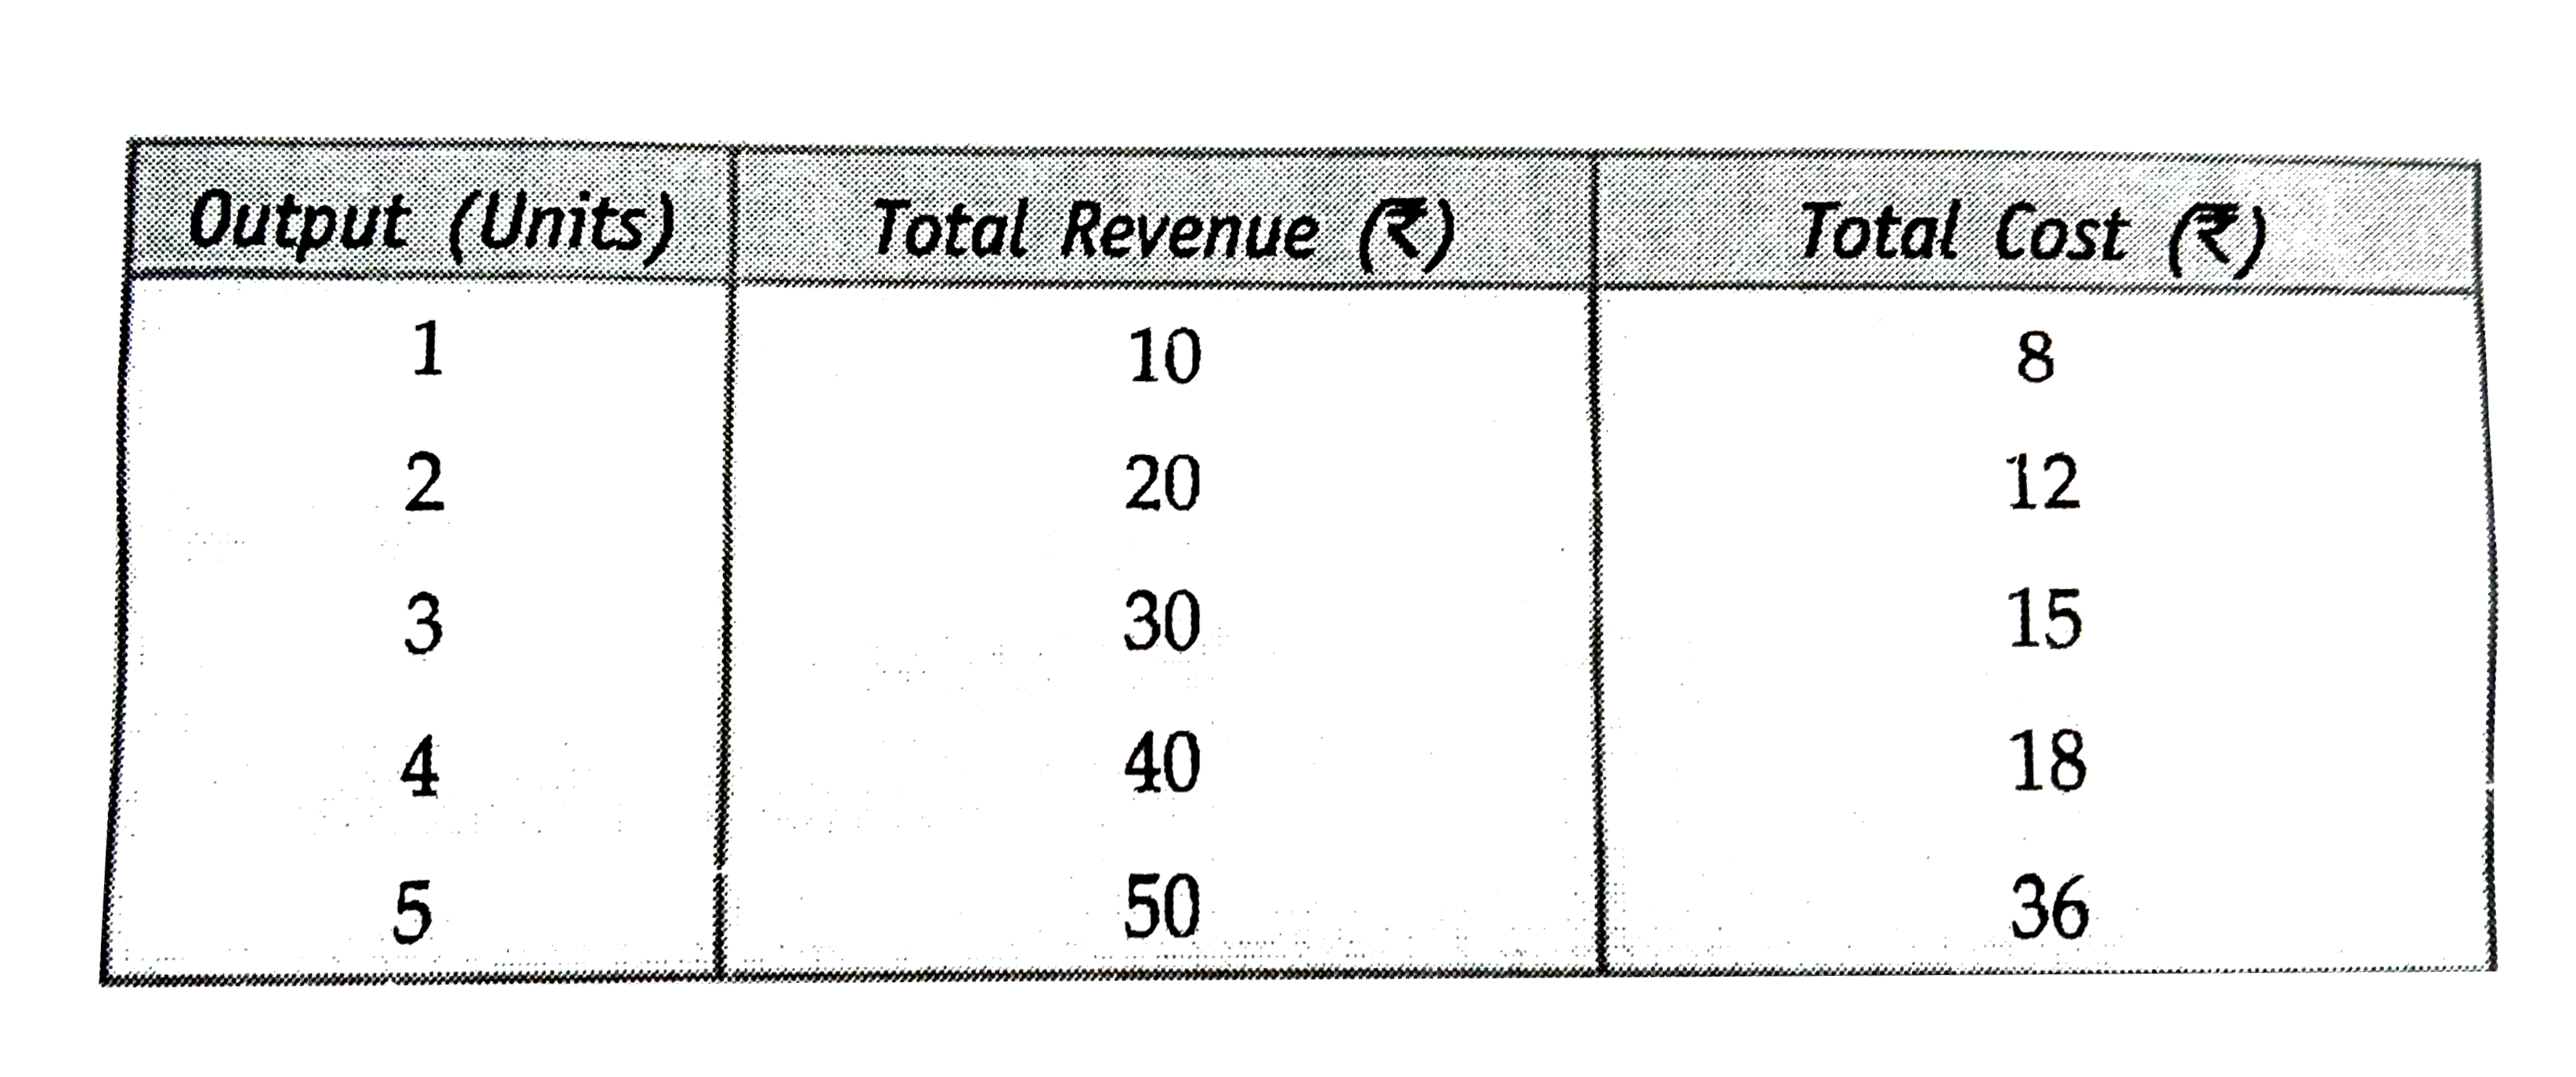
- The following table shows the total revenue and total cost schedules o...
Text Solution
|
- Given below is a cost and revenue schedule of a producer. At what leve...
Text Solution
|
- The price of commodity X is Rs.20 per unit and it remains constant. Gi...
Text Solution
|
- Find out the level of output at which the producer is in equilibrium.
Text Solution
|
- On the basis of the information given below, determine the level of ou...
Text Solution
|
- From the following information about a firm, find the firm's equilibri...
Text Solution
|
- From the following information about a firm, find the firm's equilibri...
Text Solution
|