Home
Class 11
MATHS
An analysis of monthly wages paid to wor...

An analysis of monthly wages paid to workers intwo firms A and B, belonging to the same industry, gives the following results:

(i) Which firm A or B pays larger amount as monthly wages?
(ii) Which firm A or B shows greater variability in individual wages?

Text Solution

Verified by Experts

(i) Total wages of firm A employees
`=5253xx586=Rs. 30,78,258`
Total wages of firm B employees
`=5253xx648=Rs. 34,03,944`
`:.` Firm B pays larger amount as monthly wages.
(ii) Coefficient of variation of wages of firm A
`=(sigma)/x xx100`
`=(sqrt(100))/5253xx100=0.19`
Coefficient of variation of wages of firm B
`=(sigma)/x xx 100`
`=(sqrt(121))/5253xx100=0.21`
`:.` Firm B shows greater variability in wages.
Promotional Banner

Topper's Solved these Questions

  • STATISTICS

    NAGEEN PRAKASHAN|Exercise MISCELLANEOUS EXERCISE|7 Videos
  • STATISTICS

    NAGEEN PRAKASHAN|Exercise EXERCISE|24 Videos
  • SETS

    NAGEEN PRAKASHAN|Exercise MISC Exercise|16 Videos
  • STRAIGHT LINES

    NAGEEN PRAKASHAN|Exercise Exercise|206 Videos

Similar Questions

Explore conceptually related problems

An analysis of monthly wages paid to workers in two firms A and B, belonging to the same industry, gives the following results: Firm A Firm B No. of wages earners 586 684 Mean of monthly wages Rs. 5253 Rs. 5253 Variance of the distribution of wages 100 121 Which firm A or B pays to larger mount as monthly wages? Which firm A or B shows greater variability in individual wages?

An analysis of monthly wages paid to workers in two firms A and B, belonging to the same industry, gives the following result No. of wage earners Firm A Firm B Mean of monthly wages Rs 5253 Rs 5253 Variance of the distribution 100 121 of wages (i) Which firm A or B pays larger amount as monthly wages? (ii) Which firm, A or B, show greater variability in individual wages?

An alalysis of monthly wages paid to the workers in two firms A and B belonging to the same industry the following result: The average of monthly wages and variance of distribution of wages of all workers in the firms A and B taken together are

An analysis of the weekly wages paid to workers in two firms A and B, belonging to the same industry gives the following results; Firm A Firm B No. of wages earners 586 648 Average weekly wages Rs. 2. Rs. 47.5 Distribution of wages 100 121 Which firm A or B pays out larger amount as weekly wages? Which firm A or B has greater variability in individual wages?

Two plants A and B of a factory show following results about the number of workers and the wages paid to them.A B No.of workers 50006000 Average monthly wages Rs 2500Rs2500 Variance of distribution 81100 of wages In which plant,A or B is there greater variability in individual wages?

Two plants A and B of a factory show following results about the number of workers and the wages paid to them.Plant A Plant B No.of workers 50006000 Average monthly wages Rs.2500 Rs.2500 Variance of distribution of wages 81100 In which plant A or B is there greater variability in individual wages?

A alone can finish a piece of work in 10 days which B alone can finish in 15 days . If they work together and finish it , then out of total wages of Rs. 225 the amount in rupees that A will get .

NAGEEN PRAKASHAN-STATISTICS-NCERT QUESTIONS
  1. Find the mean deviation about the median for the data in Question

    Text Solution

    |

  2. Find the mean deviation about the mean for the data in Question:

    Text Solution

    |

  3. Find the mean deviation about the mean for the data in Question:

    Text Solution

    |

  4. Find the mean deviation about median for the following data:

    Text Solution

    |

  5. Calculate the mean deviatioin about median age for the age distributio...

    Text Solution

    |

  6. Find the mean and variance for each of the data : 6, 7, 10 , 12 , 13 ,...

    Text Solution

    |

  7. Find the mean and variance for each of the data : First n natural num...

    Text Solution

    |

  8. Find the mean and variance for each of the data : First 10 multiples ...

    Text Solution

    |

  9. Find the mean and variance for each of the data in Question:

    Text Solution

    |

  10. Find the mean and variance for each of the data in Question:

    Text Solution

    |

  11. Find the mean and standard deviation using shout-cut method.

    Text Solution

    |

  12. Find the mean and variance for the following frequency distributions i...

    Text Solution

    |

  13. Find the mean and variance for the following frequency distributions i...

    Text Solution

    |

  14. Find the mean variance and standard deviation using short-cut method

    Text Solution

    |

  15. The diameter of circles (in mm) drawn in a design are given below: ...

    Text Solution

    |

  16. From the data given below state which group is more variable A or B?

    Text Solution

    |

  17. From the prices of shares X and Y below, find out which is more sta...

    Text Solution

    |

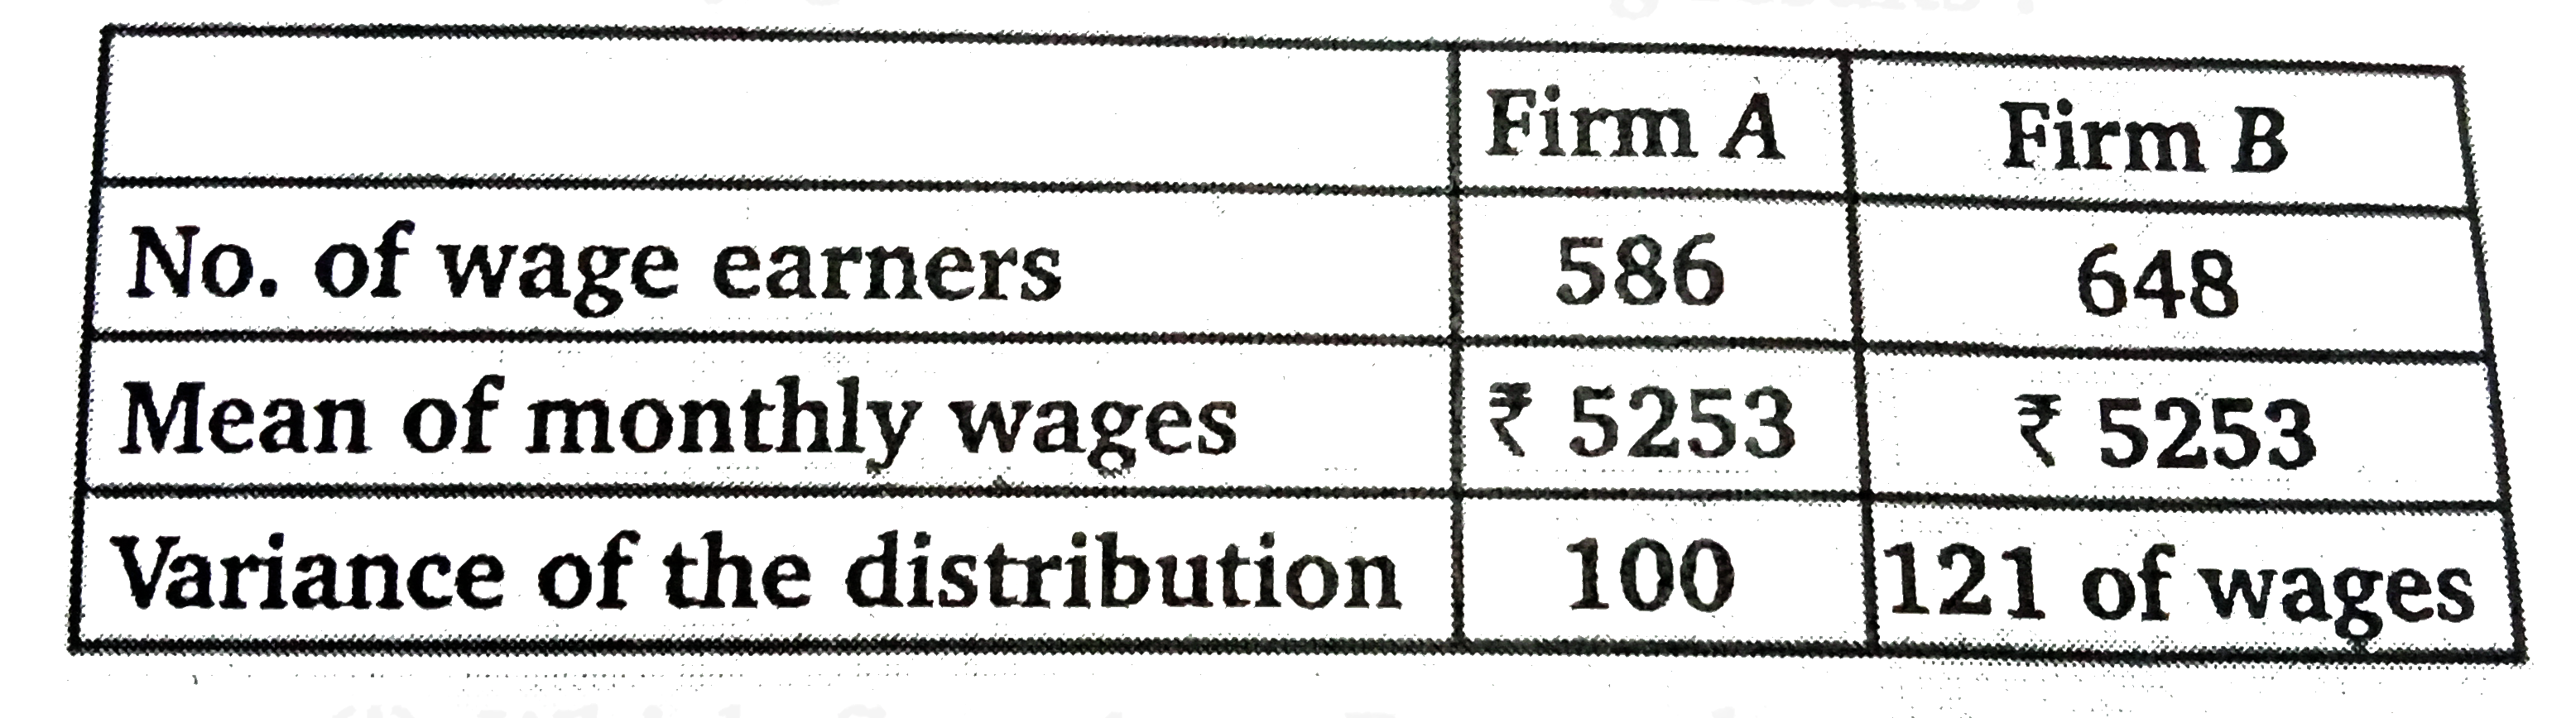
  18. An analysis of monthly wages paid to workers intwo firms A and B, belo...

    Text Solution

    |

  19. The following is ht record of goals scored by team A in a football ...

    Text Solution

    |

  20. The sum and sum of square corresponding to length x (in cm) and weight...

    Text Solution

    |