A

B

C

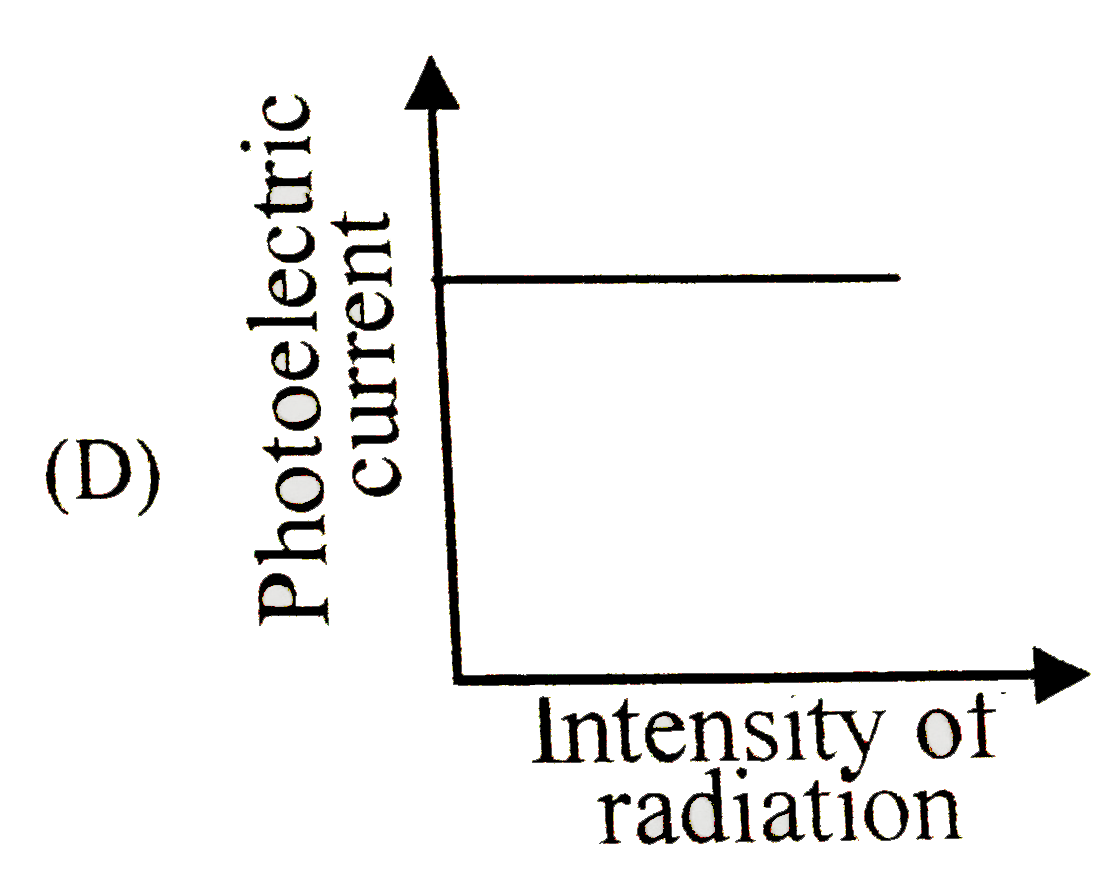
D
Text Solution
Verified by Experts
The correct Answer is:


Topper's Solved these Questions
Similar Questions
Explore conceptually related problems
KVPY PREVIOUS YEAR-KVPY-exercise
- The graph that depicts Einstein photoelectric effect for a monochromat...
Text Solution
|
- Which of the following is correct?
Text Solution
|
- Which of the following contains 1^@, 2^@ and 3^@ carbon atom?
Text Solution
|
- Highest dipole moment among the following:
Text Solution
|
- I.P values (in ev) of Na, Mg, Al, Si,Ar are 5.47,7.6,5.98,8.15,15.75 (...
Text Solution
|
- Which of the following can be purified by steam distillation?
Text Solution
|
- A 10 litre container has 1 litre water gas (CO:H2::1:1) 9 litre of ato...
Text Solution
|
- The unpaired electron of Cu have quantum number
Text Solution
|
- A compound formed by elements M and N crystallizes in HCP lattice. The...
Text Solution
|
- Find the number of stereoisomers in [M1(NH3)3Cl3] and [M1(en)2Cl2]Cl r...
Text Solution
|
- CH3COOH overset(acid)larr X overset(Reduction)to CH3CH2NH2
Text Solution
|
- Calculate magetic moment of Ni in Ni(dmg)2 complex
Text Solution
|
- A 0.1 molal aqueous solution of CuSO4.5H2O at 1bar pressure. find the ...
Text Solution
|
- Which of the following is always true for a spontaneous process
Text Solution
|
- Which of the following will give a blue solution when copper is dipped...
Text Solution
|