A
B
C
D
Text Solution
Verified by Experts
The correct Answer is:


Topper's Solved these Questions
Similar Questions
Explore conceptually related problems
DINESH PUBLICATION-PHOTOSYNTHESIS-CYG
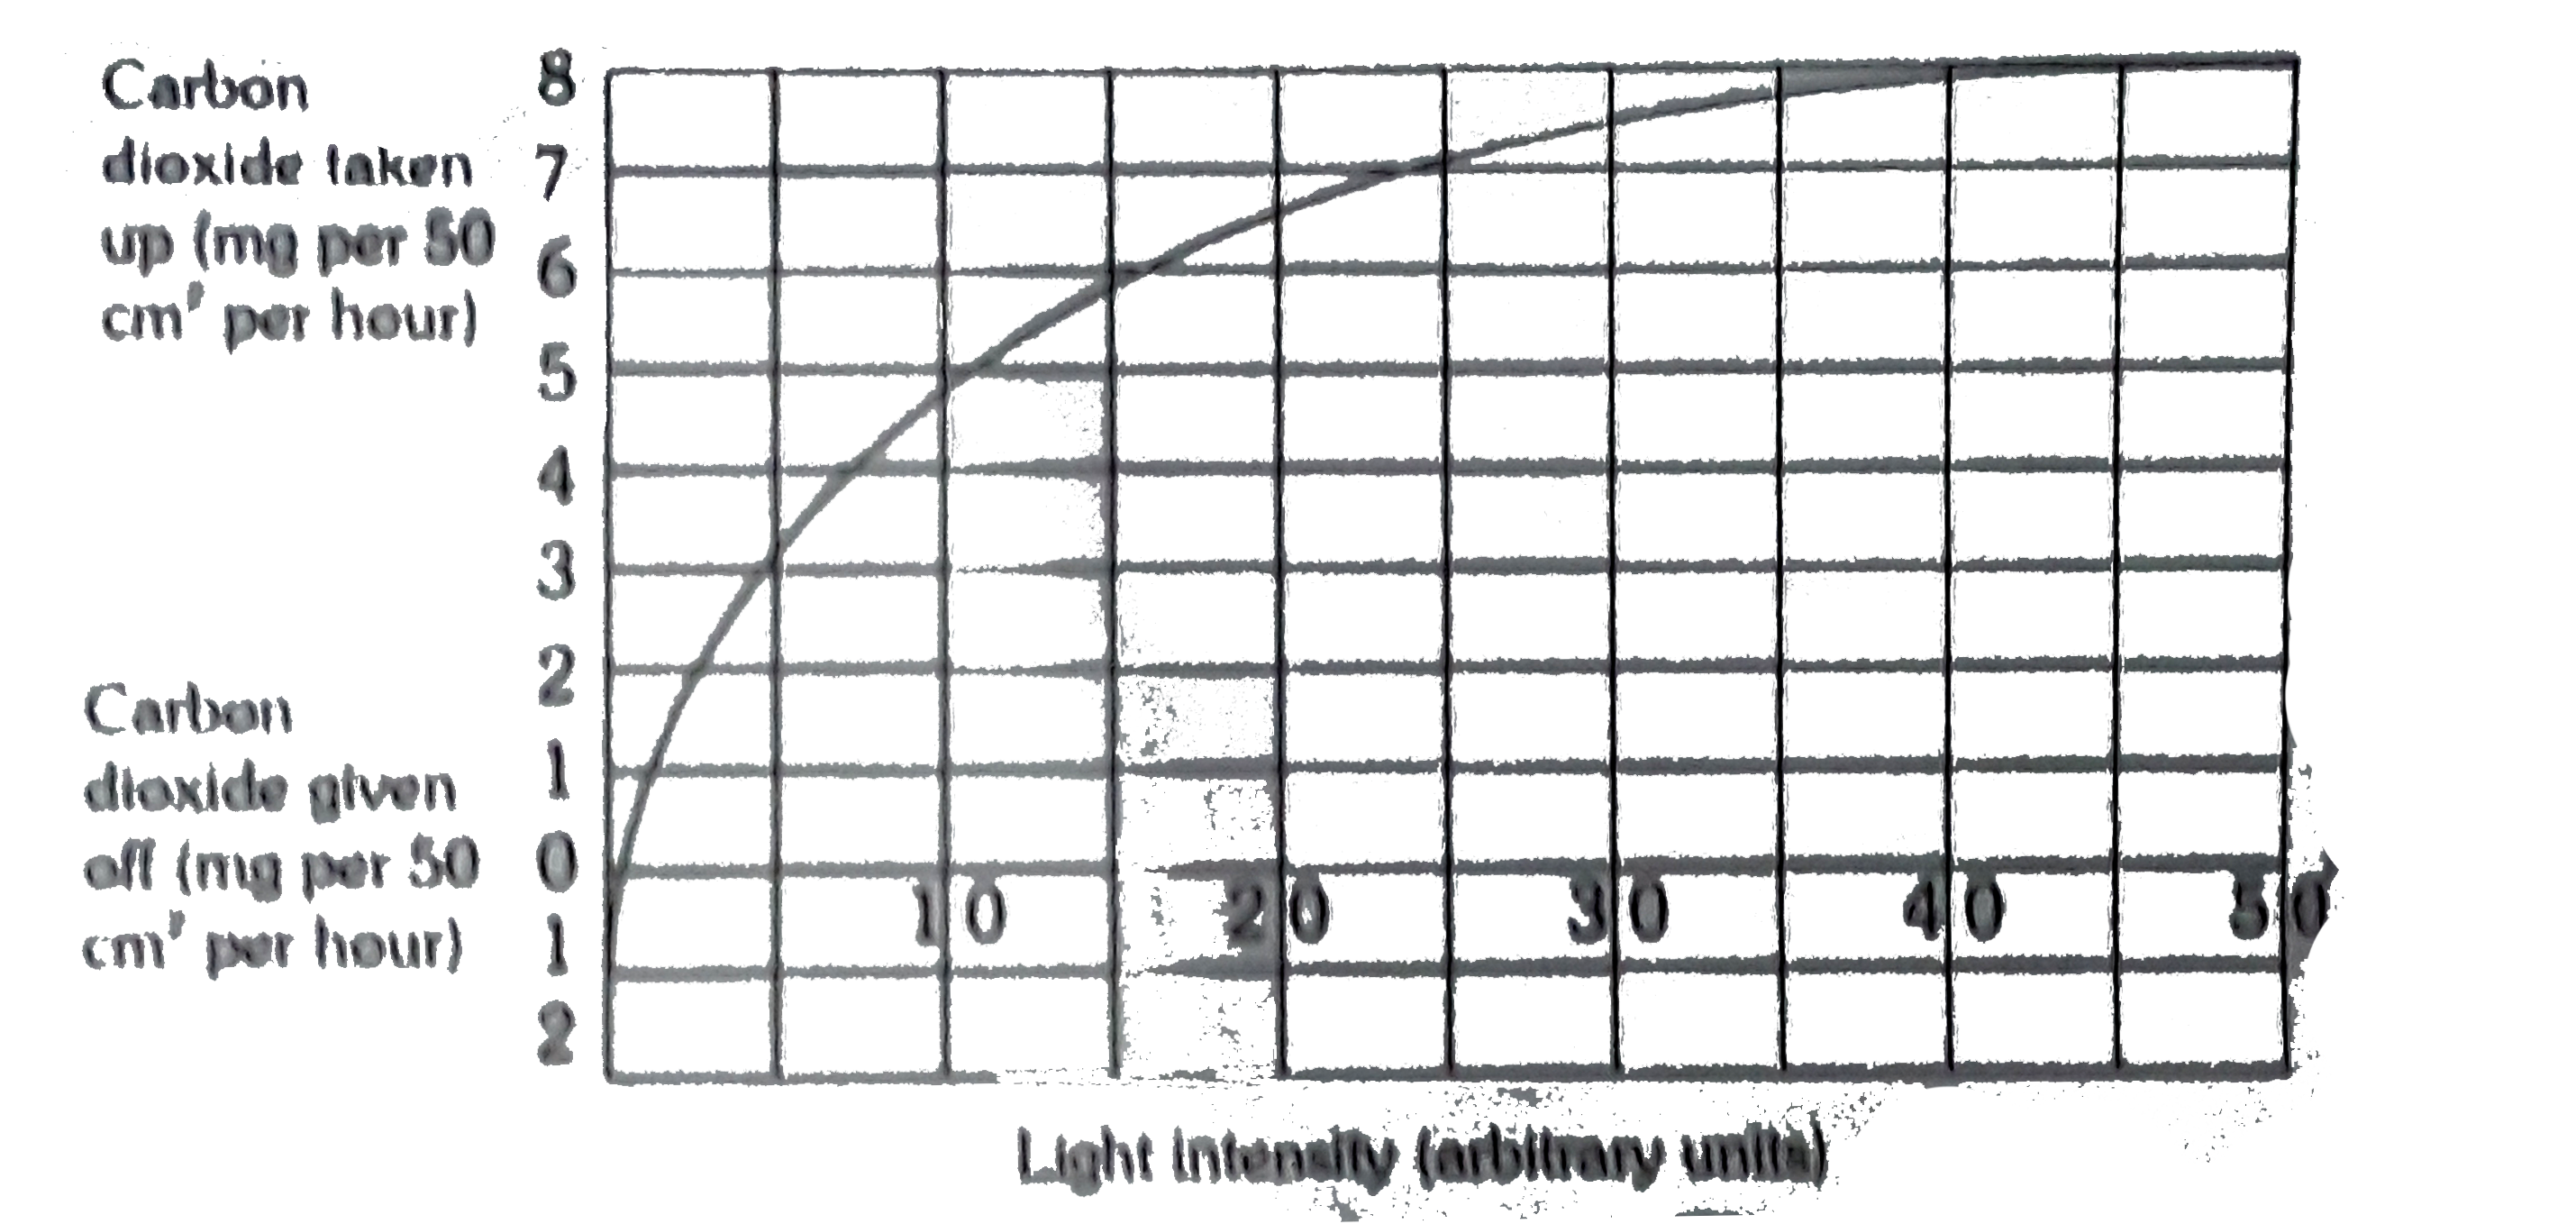
- The graph shows the relation between light intensity and the giving of...
Text Solution
|
- Solar radiations contain ultraviolet radiations of wavelength
Text Solution
|
- Soil humus theory of plant nourishment was given by
Text Solution
|
- Chlorophyll a is called universal photosynthetic pigment because it oc...
Text Solution
|
- Which one is Hill oxidant ?
Text Solution
|
- Action spectrum of photosynthesis was discovered by
Text Solution
|
- Girdling experiments cannot be successful in case of Cucurbita because...
Text Solution
|
- First transitory chemical formed by reaction between CO(2) and RuBP is
Text Solution
|
- PEPco occurs in
Text Solution
|
- the acientist who discovered atmospheric CO(2) concentration to be sub...
Text Solution
|
- Wilmott's bubbler is meant for ptoving
Text Solution
|