A
B
C
D
Text Solution
Verified by Experts
The correct Answer is:


Topper's Solved these Questions
Similar Questions
Explore conceptually related problems
DINESH PUBLICATION-MOLECULES OF THE CELL-RQ
- Prostaflandins are
Text Solution
|
- Which is corretly identified alongwith its function
Text Solution
|
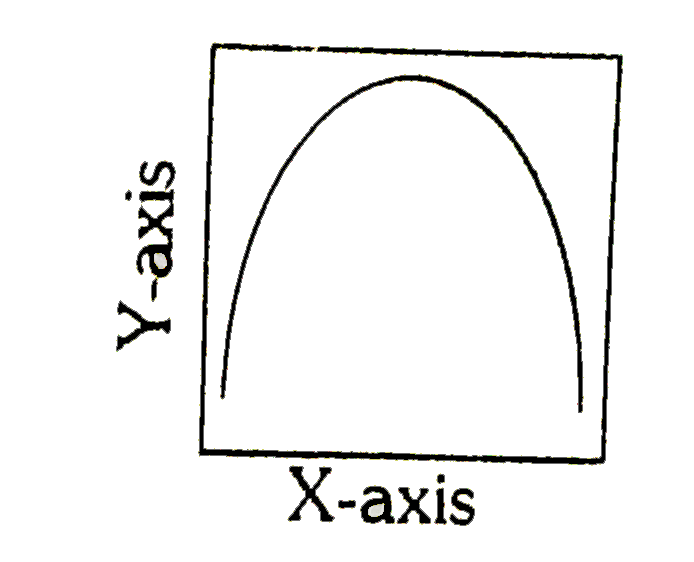
- The curve given below show enzymatic activity with relation to three c...
Text Solution
|
- Major function of mineral Magnesium is
Text Solution
|
- Steroids are
Text Solution
|
- Which of the following sugars cannot split into further groups by hyd...
Text Solution
|
- Apoenzyme is
Text Solution
|
- Assertion : Enzymes lower the activation energy of the reactant molecu...
Text Solution
|
- In a 50 g living tissue, the amount of water would be
Text Solution
|
- Which is present in very little quantity in the body ?
Text Solution
|
- Given below is the diagrammatic representation of one of the categorie...
Text Solution
|
- Which one is the most abundant protein in the animal world
Text Solution
|
- Which one out of A-D given below correctly represents the structural f...
Text Solution
|
- Which is not true of enzymes
Text Solution
|
- Identify the polysaccharide with beta-glycosidic bonds
Text Solution
|
- Simple storage protein that coagulates upon heating but remains solubl...
Text Solution
|
- Iunlin is a
Text Solution
|
- Higher animals cannot synthesize few fatty acids which are very essent...
Text Solution
|
- Thermolabile protein part of enzyme is
Text Solution
|
- Which is used for staining lipids ?
Text Solution
|