Text Solution
Verified by Experts
The correct Answer is:


Topper's Solved these Questions
PRODUCER'S EQUILIBRIUM
SANDEEP GARG|Exercise Revision|13 VideosPRODUCER'S EQUILIBRIUM
SANDEEP GARG|Exercise Very Short Answer Type|7 VideosPRODUCER'S EQUILIBRIUM
SANDEEP GARG|Exercise TRUE AND FALSE|4 VideosPRICE DETERMINATION AND SIMPLE APPLICATIONS
SANDEEP GARG|Exercise Long Answer Type Questions|28 VideosPRODUCTION FUNCTION
SANDEEP GARG|Exercise Practicals on TP, AP and MP|14 Videos
Similar Questions
Explore conceptually related problems
SANDEEP GARG-PRODUCER'S EQUILIBRIUM-Guidelines To NCERT
- What conditions must hold if a profit-maximising firm produces positiv...
Text Solution
|
- Can there be a positive level of output that a profit-maximising firm ...
Text Solution
|
- Will a profit-maximising firm in a competitive market ever produce a p...
Text Solution
|
- Will a profit- maximising firm in a competitive merket produce a posit...
Text Solution
|
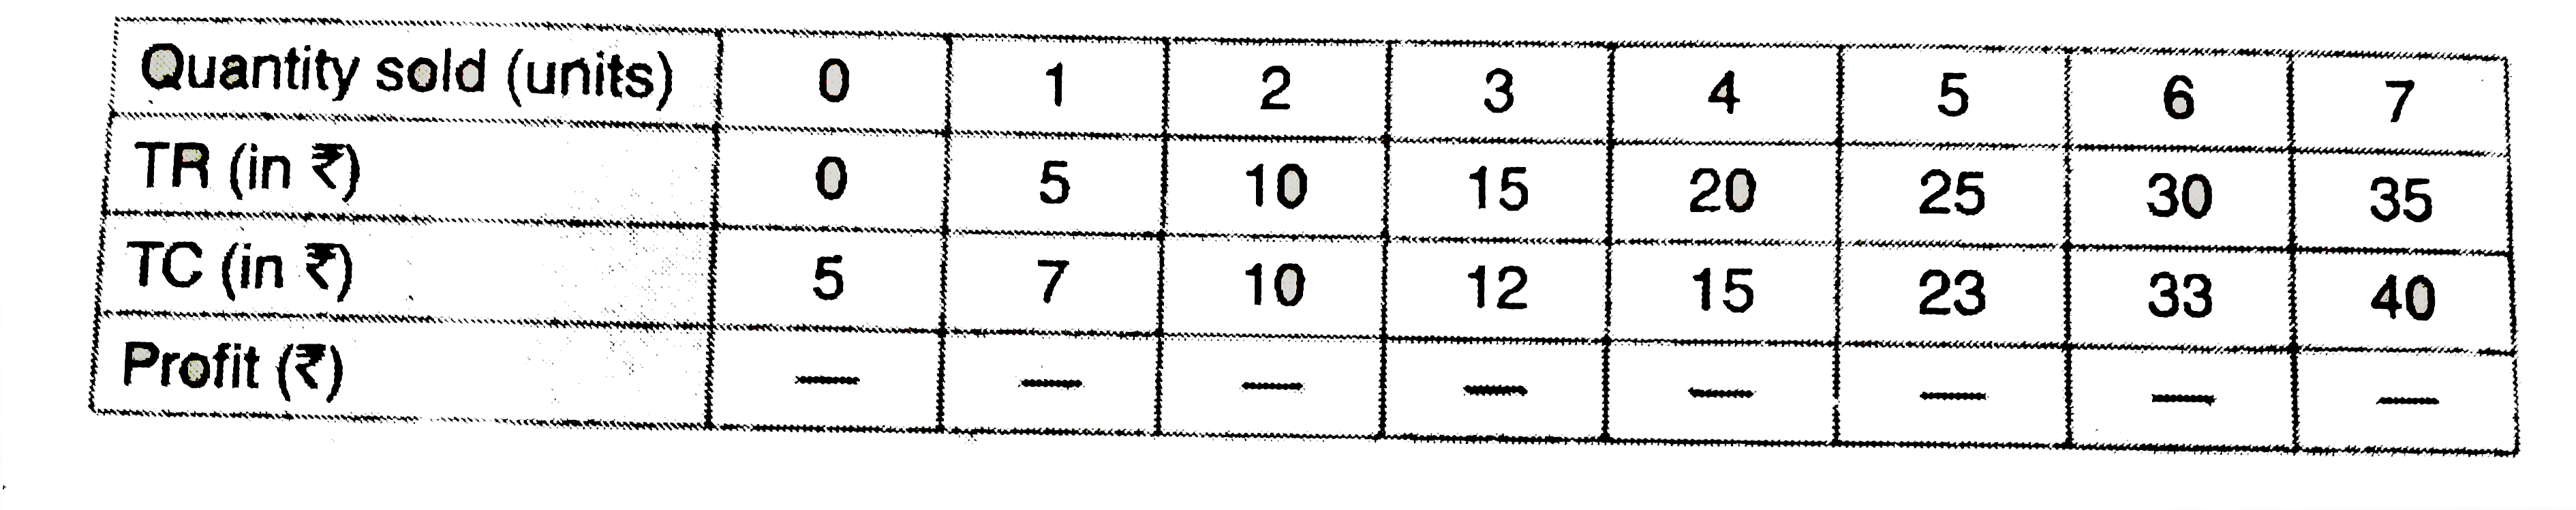
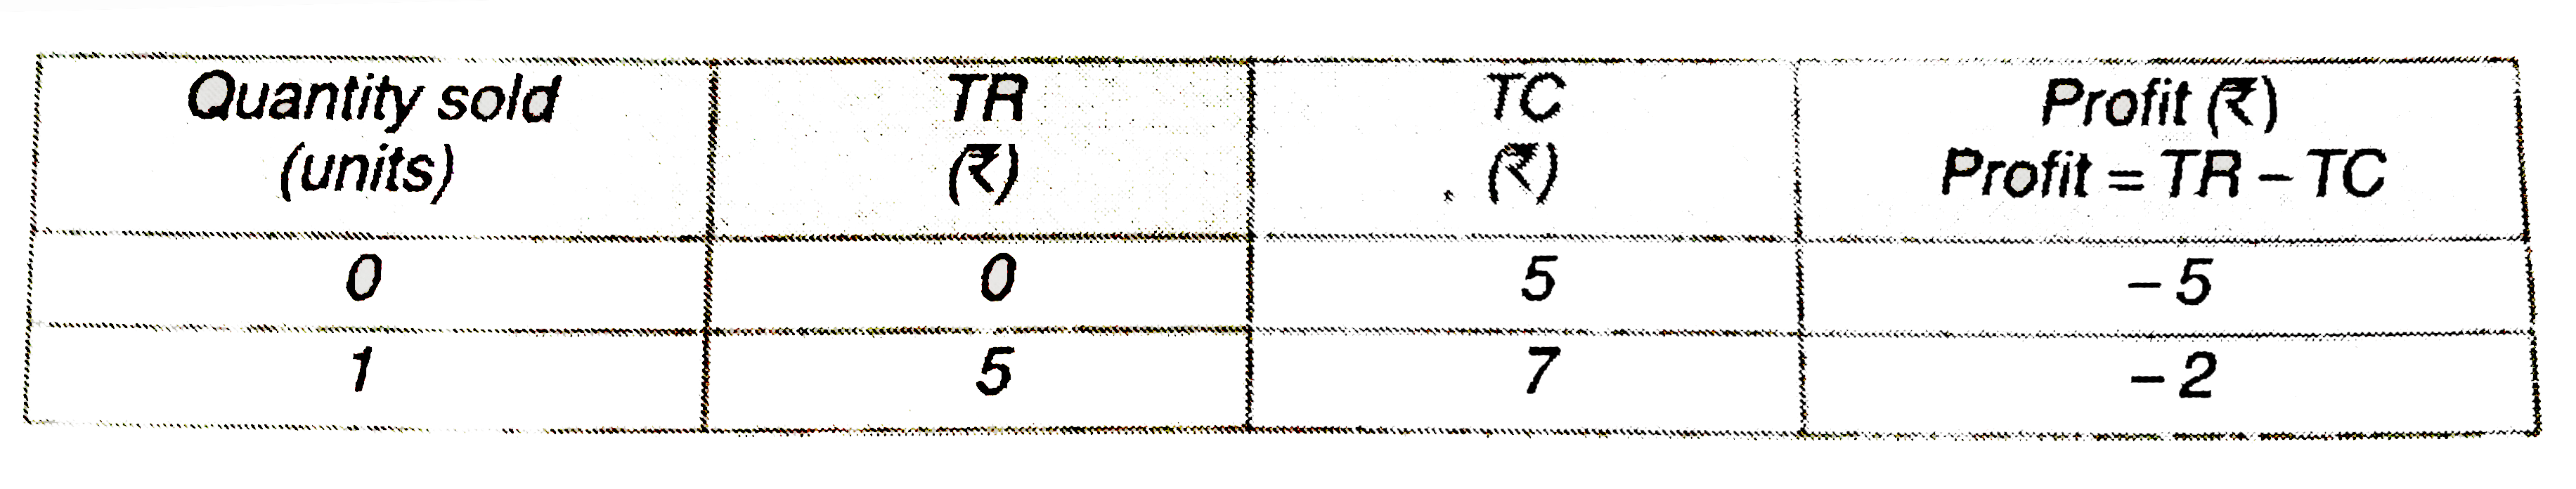
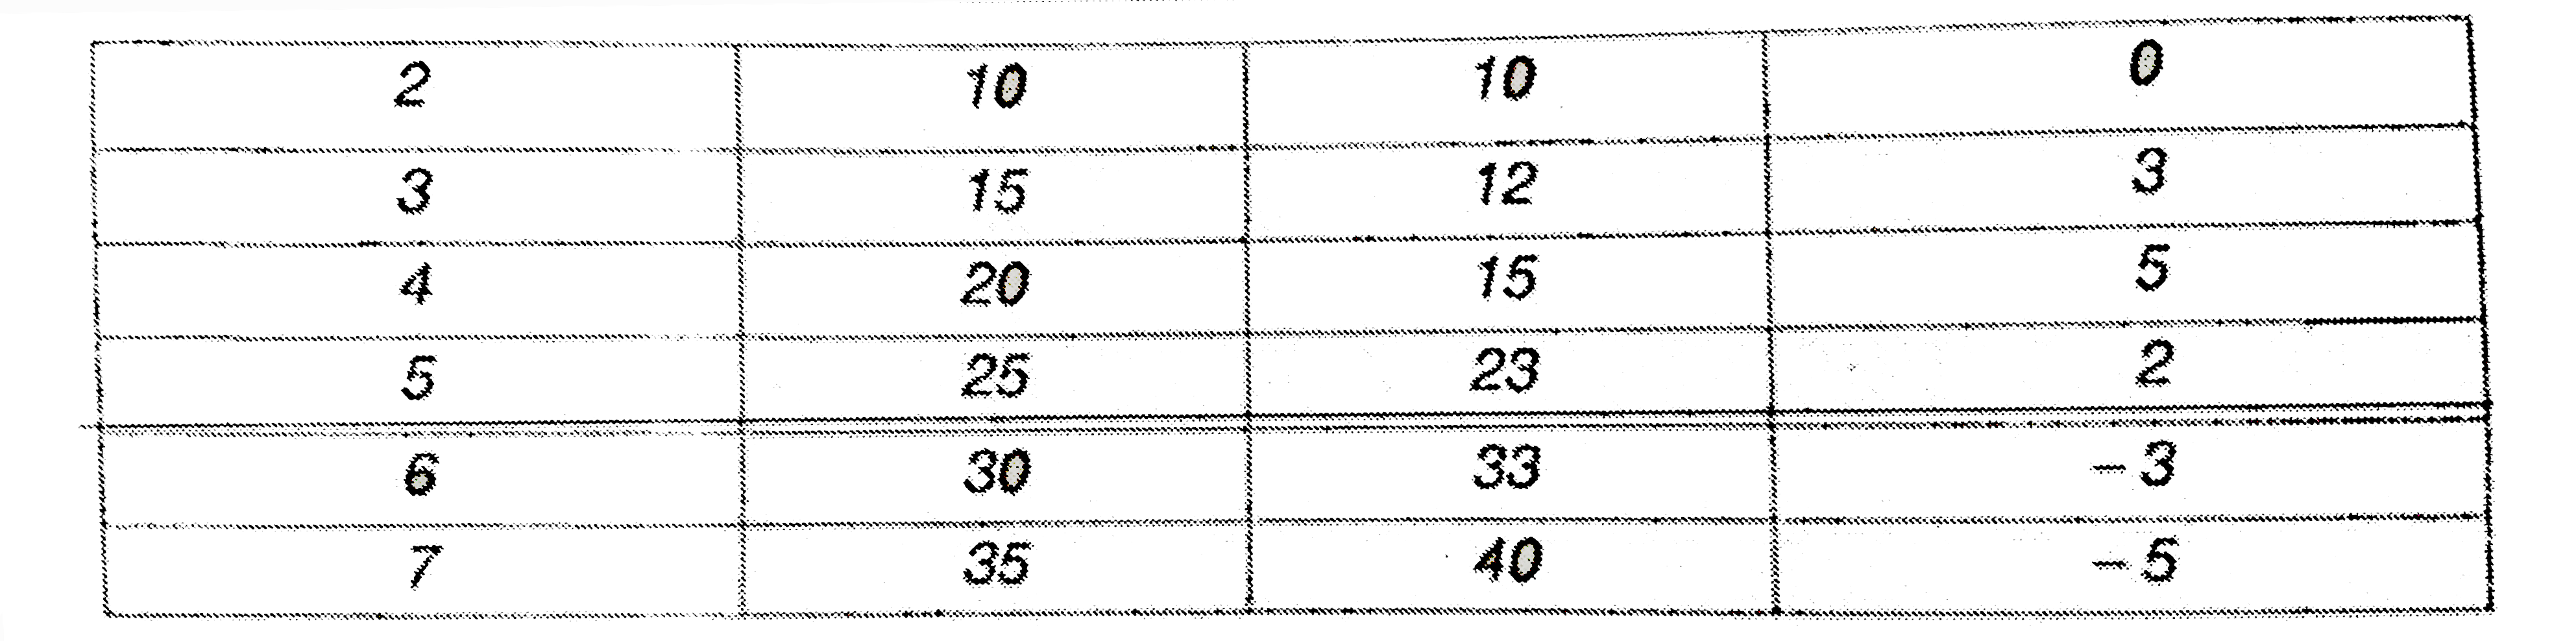
- The following table shows the total revenue and total cost schedules o...
Text Solution
|
- The following table shows the total cost schedule of a competitive fir...
Text Solution
|