A
B
C
D
Text Solution
Verified by Experts
The correct Answer is:


Topper's Solved these Questions
PRODUCER'S EQUILIBRIUM
SANDEEP GARG|Exercise Very Short Answer Type|7 VideosPRODUCER'S EQUILIBRIUM
SANDEEP GARG|Exercise Unsolved Practicals|12 VideosPRODUCER'S EQUILIBRIUM
SANDEEP GARG|Exercise Guidelines To NCERT|6 VideosPRICE DETERMINATION AND SIMPLE APPLICATIONS
SANDEEP GARG|Exercise Long Answer Type Questions|28 VideosPRODUCTION FUNCTION
SANDEEP GARG|Exercise Practicals on TP, AP and MP|14 Videos
Similar Questions
Explore conceptually related problems
SANDEEP GARG-PRODUCER'S EQUILIBRIUM-Revision
- Producer's Equilibrium under MR-MC approach is achieved when :
Text Solution
|
- "" refers to a situation when a firm has no intention expand or contra...
Text Solution
|
- Excess of receipts from sale of goods over expenditure incurred on pro...
Text Solution
|
- Producer is not at equailibrium when MC gt MR bacause :
Text Solution
|
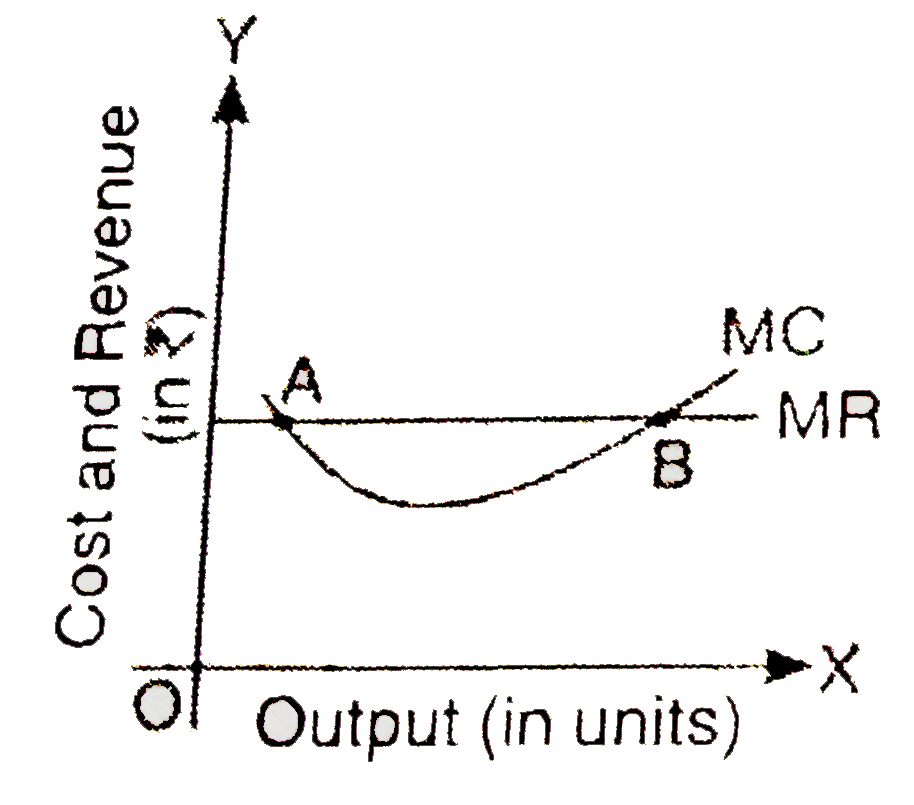
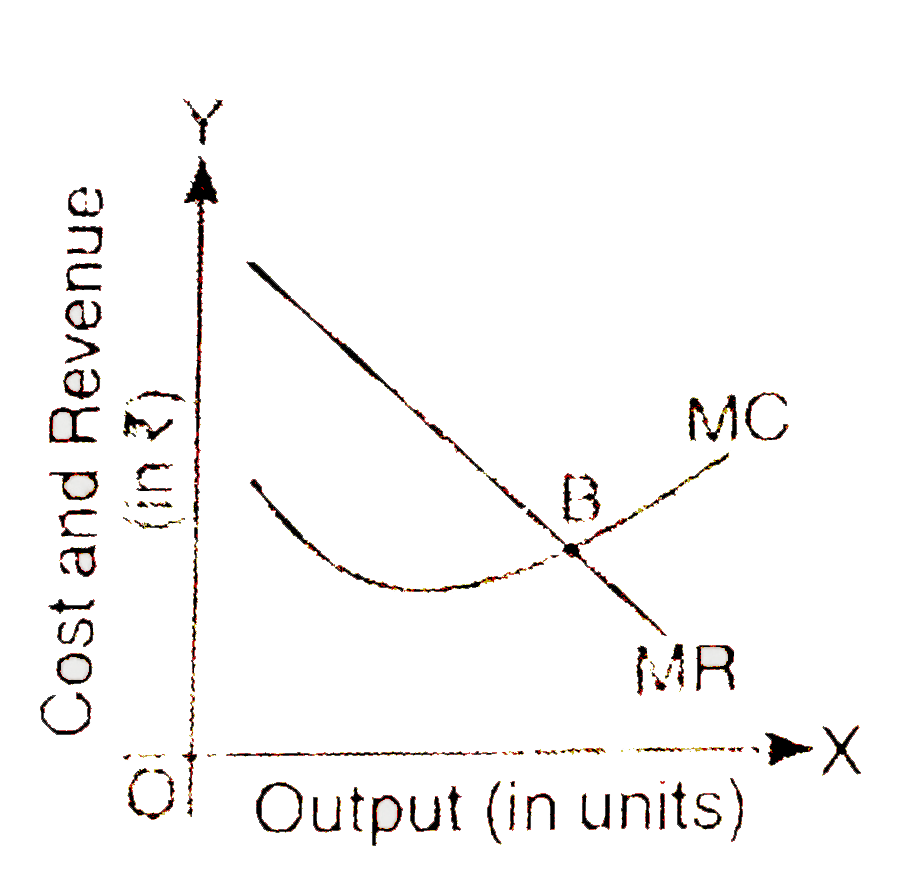
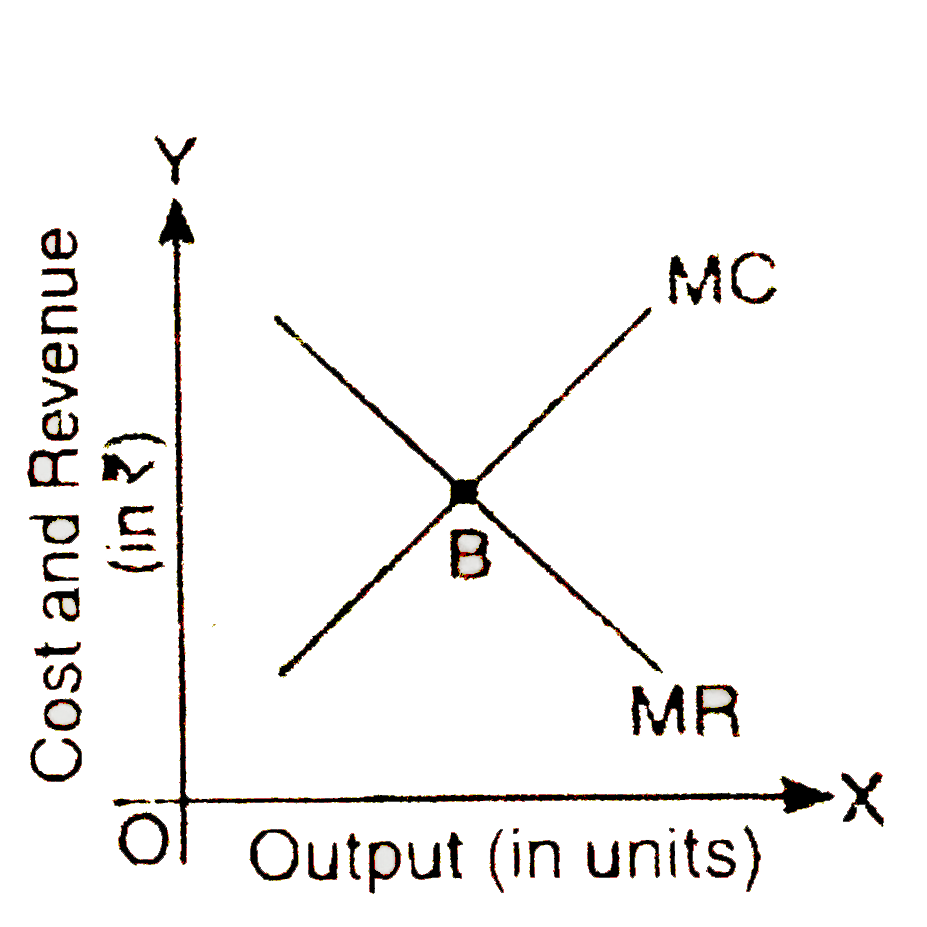
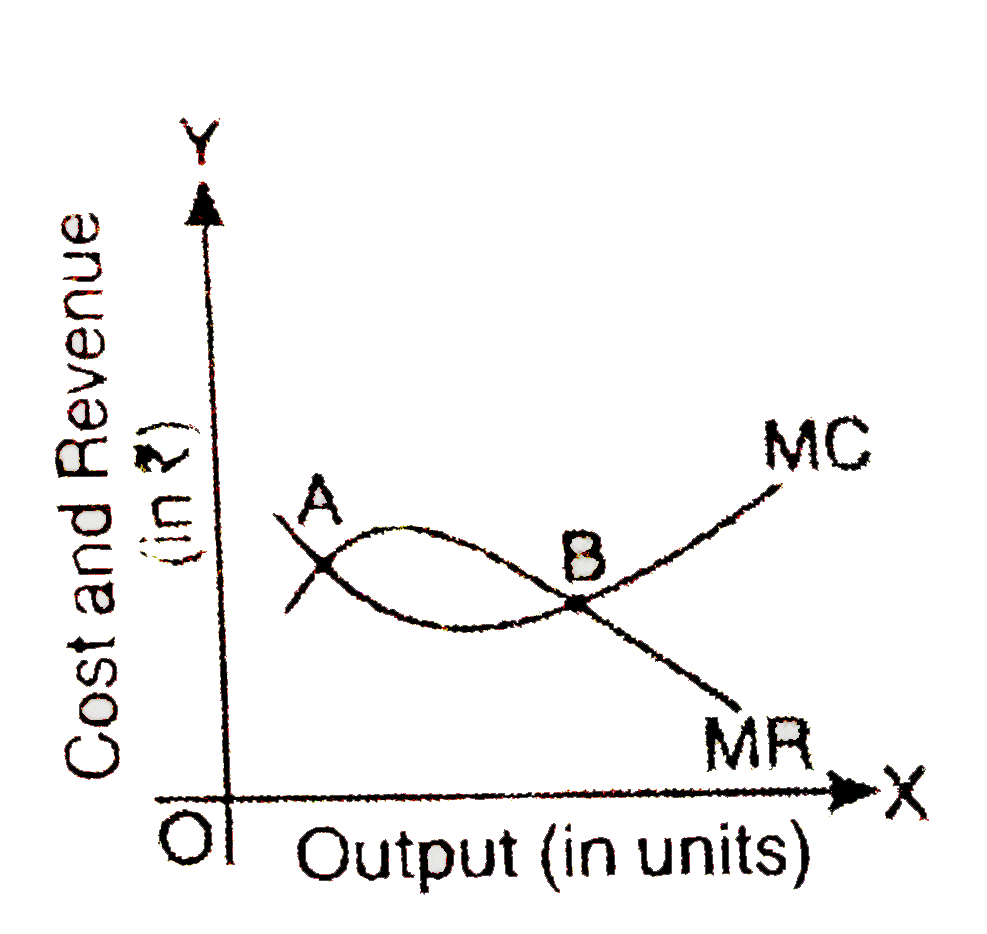
- The following diagram correctly depicts the producer's equilibrium in ...
Text Solution
|
- In the following schedule , producer's equilibrium is at ""
Text Solution
|
- If MR is more than MC at a particular level of output , then producer ...
Text Solution
|
- In the following diagram , producer's equilibrium is achieved at poin ...
Text Solution
|
- Producer's equilibrium refers to stage of that output level when :
Text Solution
|
- In case of perfect competition a firm is in equilibrium when:
Text Solution
|
- The profit of a firm diminishes when "" exceeds "":
Text Solution
|
- If Marginal Cost =MC and Marginal Revenue =MR , then for achieving equ...
Text Solution
|
- When price falls with rise in output , then Producer's Equilibrium is ...
Text Solution
|