A
B
C
D
Text Solution
Verified by Experts
The correct Answer is:


Topper's Solved these Questions
PHOTOSYNTHESIS IN HIGHER PLANTS
A2Z|Exercise Section A : Topicwise Questions Topic 2 : Light Reaction (the Electron Transport , Cyclic And Non-cy|61 VideosPHOTOSYNTHESIS IN HIGHER PLANTS
A2Z|Exercise Section A : Topicwise Questions Topic 3 : Dark Reaction (the Calvin Cycle)|27 VideosNEURAL CONTROL AND COORDINATION
A2Z|Exercise Section D : Chapter-end Test|50 VideosPLANT GROWTH AND DEVELOPMENT
A2Z|Exercise Section D : Chapter-end Test|50 Videos
Similar Questions
Explore conceptually related problems
A2Z-PHOTOSYNTHESIS IN HIGHER PLANTS-Section D : Chapter End Test
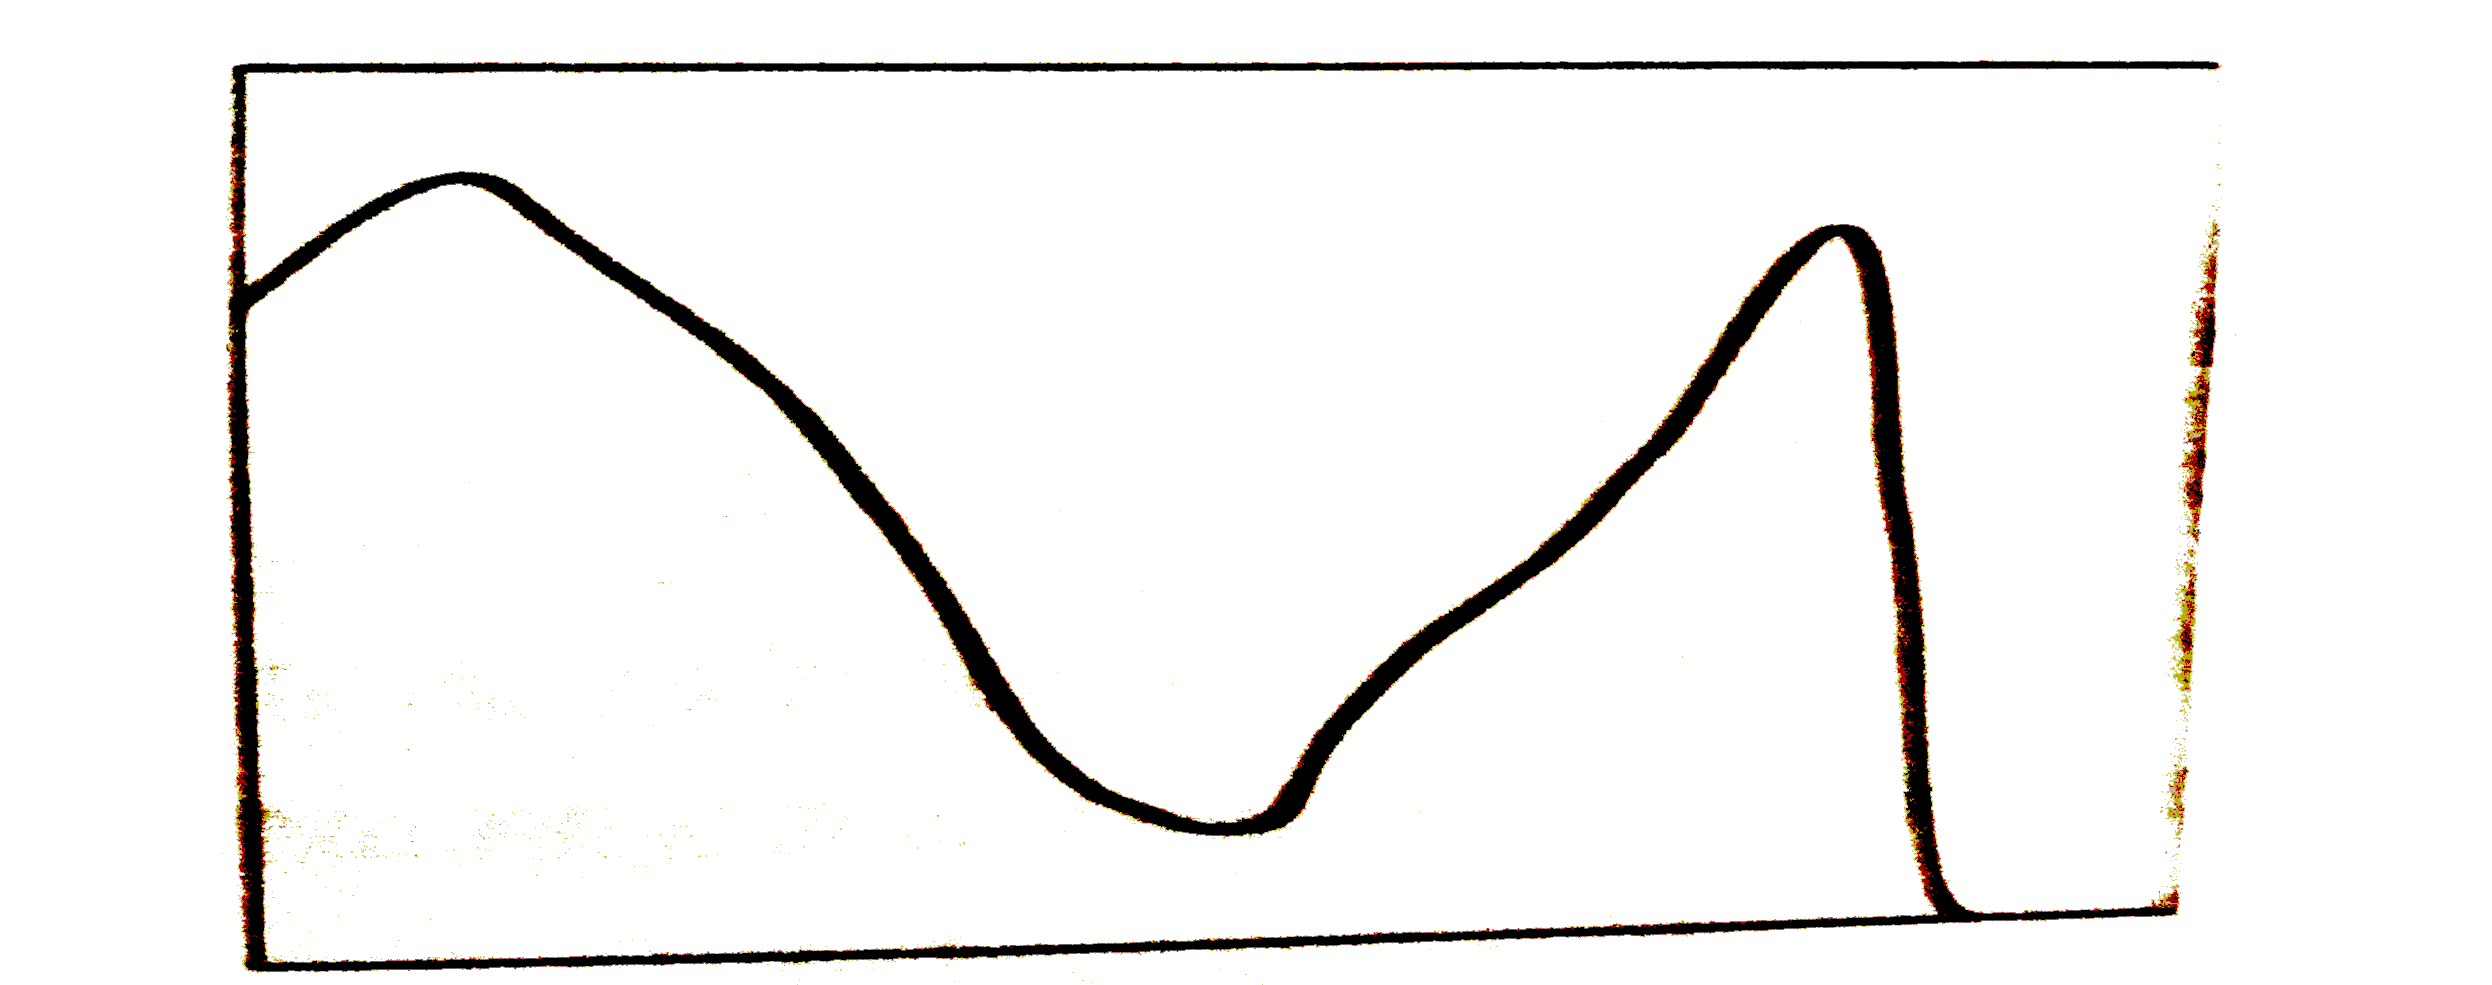
- The following graph shows the
Text Solution
|
- Both respira
Text Solution
|
- the empirical formula for chlorophyll a is
Text Solution
|
- The precentag of light energy utilized for photosynthesis by highe...
Text Solution
|
- Chlorophyll b is
Text Solution
|
- Th.: process of photosy,1thesis is
Text Solution
|
- Complete girdling ultimately kills the tree due to
Text Solution
|
- when cell ceonverts light energy into chemical energy, which of the fo...
Text Solution
|
- Chief functions of leaves are
Text Solution
|
- Synthesis of ADP+ Pi ~ ATP in grana photosynthesis is
Text Solution
|
- the number of chlorophyll molecules in a quantasome id
Text Solution
|
- Algae often float on surface of water during day but sink down during ...
Text Solution
|
- The size of chlorophyll molecule is
Text Solution
|
- Which is correct about chlorophyll a and b in leaves of higher plants?
Text Solution
|
- Cytochromes are
Text Solution
|
- Formation of ATP in photosynthesis and respiration is an oxidation pro...
Text Solution
|
- Photosynthetic enhancement with flashing light was first observed by
Text Solution
|
- PS II contains a non-chlorophyllous pigment in blue-green algae
Text Solution
|
- Which of the following photosynthesis bacteria have both PS-I and PS-I...
Text Solution
|
- The first experiment on photosynthesis in flashing light were c...
Text Solution
|
- At high oxygen concentration, the rate of photosynthesis decreases due...
Text Solution
|