Text Solution
Verified by Experts


Topper's Solved these Questions
THERMOMETRY THERMAL EXPANSION AND KINETIC THEORY OF GASES
DC PANDEY|Exercise Check point 14.1|10 VideosTHERMOMETRY THERMAL EXPANSION AND KINETIC THEORY OF GASES
DC PANDEY|Exercise Check point 14.2|20 VideosSUPERPOSITION OF WAVES
DC PANDEY|Exercise Level 2 Subjective|8 VideosTHERMOMETRY,THERMAL EXPANSION & KINETIC THEORY OF GASES
DC PANDEY|Exercise Level 2 Subjective|9 Videos
Similar Questions
Explore conceptually related problems
DC PANDEY-THERMOMETRY THERMAL EXPANSION AND KINETIC THEORY OF GASES-Medical entrance gallary
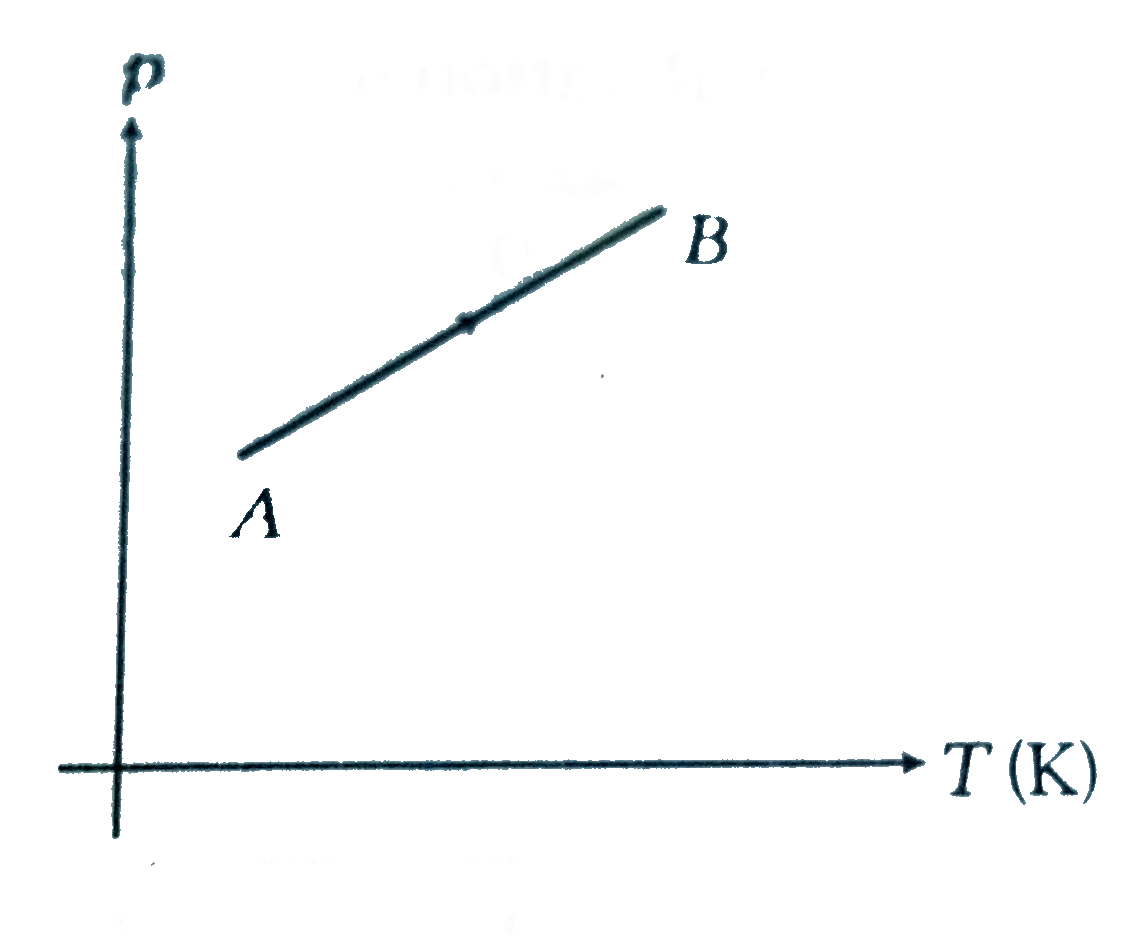
- The p-T graph for the given mass of an ideal gas is shown in figure. W...
Text Solution
|
- A fiven sample of an ideal gas occupise a volume V at a pressure p an...
Text Solution
|
- Coefficient of liner expansion of brass and steel rods are alpha(1) an...
Text Solution
|
- The molecules of a given mass of a gas have rms velocity of 200 m//s a...
Text Solution
|
- The rms speed of oxygen molecule in a gas at 27^(@)C would be given by
Text Solution
|
- The pressure of an ideal gas is directly proportional to
Text Solution
|
- Two metal rods of lengths L(1) and L(2) and coefficients of linear exp...
Text Solution
|
- The ratio of rms speed of an ideal gas molecules at pressure p to that...
Text Solution
|
- The rms speed of oxygen molecules in a gas is v. If the temperature is...
Text Solution
|
- The deviation of a real gas from the ideal one is minimum at
Text Solution
|
- The density of hydrogen gas at STP is 0.9 kg m^(-3) The mean kinetic e...
Text Solution
|
- A substance having coefficient of critical expension 4.9xx10^(-4)"^(@)...
Text Solution
|
- At constant pressure, the ratio of increases in volume of an ideal gas...
Text Solution
|
- When water is heated from 0^(@)C to 10^(@)C , its volume
Text Solution
|
- The length of s steel rod exceeds that of a brass rod by 5 cm. If the ...
Text Solution
|
- The density of water is maximum at:
Text Solution
|
- A metal rod if fixed rigidly at two ends so as to prevent its hermalex...
Text Solution
|
- Which one of the following is a wrong statement in kinetic theory of g...
Text Solution
|
- The mean free path of molecules of a gas (radius r) is inversely propo...
Text Solution
|
- The average pressure of an ideal gas is
Text Solution
|
- According to equipartition law of energy each particle in a system of ...
Text Solution
|