Home
Class 11
PHYSICS
The graph which represents the variation...

The graph which represents the variation of mean kinetic energy of moleules with temperature `""^(@)C` is ?

A

B

C

D

Text Solution

AI Generated Solution

The correct Answer is:
To solve the problem of determining the graph that represents the variation of mean kinetic energy of molecules with temperature in degrees Celsius, we can follow these steps: ### Step-by-Step Solution: 1. **Understand the Relationship**: The mean kinetic energy (E) of molecules is related to temperature (T) through the formula: \[ E = \frac{F}{2} k T \] where \( F \) is the degrees of freedom and \( k \) is the Boltzmann constant. 2. **Convert Temperature to Kelvin**: Since the formula uses temperature in Kelvin, we need to convert the temperature from degrees Celsius to Kelvin: \[ T(K) = T(°C) + 273 \] 3. **Substitute the Temperature**: Substitute the temperature in Kelvin into the kinetic energy formula: \[ E = \frac{F}{2} k (T + 273) \] This can be expanded to: \[ E = \frac{F}{2} k T + \frac{F}{2} k \cdot 273 \] 4. **Identify the Linear Equation**: The equation now resembles the linear form \( y = mx + c \), where: - \( y \) corresponds to \( E \) - \( x \) corresponds to \( T \) - \( m \) (the slope) is \( \frac{F}{2} k \) - \( c \) (the y-intercept) is \( \frac{F}{2} k \cdot 273 \) 5. **Graph Characteristics**: Since the slope \( m \) is positive, the graph of \( E \) versus \( T \) will be a straight line with a positive slope. The y-intercept will also be positive, indicating that the line crosses the y-axis above zero. 6. **Draw the Graph**: On a graph where the x-axis represents temperature (in °C) and the y-axis represents mean kinetic energy (E), the line will start from a positive intercept and rise as the temperature increases. 7. **Select the Correct Option**: Based on the characteristics of the graph derived, we can conclude that the correct option is the one that shows a straight line with a positive slope intersecting the y-axis above zero. ### Final Answer: The graph that represents the variation of mean kinetic energy of molecules with temperature in degrees Celsius is a straight line with a positive slope and a positive y-intercept. ---

To solve the problem of determining the graph that represents the variation of mean kinetic energy of molecules with temperature in degrees Celsius, we can follow these steps: ### Step-by-Step Solution: 1. **Understand the Relationship**: The mean kinetic energy (E) of molecules is related to temperature (T) through the formula: \[ E = \frac{F}{2} k T \] ...
Promotional Banner

Topper's Solved these Questions

  • THERMOMETRY THERMAL EXPANSION AND KINETIC THEORY OF GASES

    DC PANDEY|Exercise A Tacking it together|55 Videos
  • THERMOMETRY THERMAL EXPANSION AND KINETIC THEORY OF GASES

    DC PANDEY|Exercise B medical entrance special format questions|14 Videos
  • THERMOMETRY THERMAL EXPANSION AND KINETIC THEORY OF GASES

    DC PANDEY|Exercise Check point 14.3|20 Videos
  • SUPERPOSITION OF WAVES

    DC PANDEY|Exercise Level 2 Subjective|8 Videos
  • THERMOMETRY,THERMAL EXPANSION & KINETIC THEORY OF GASES

    DC PANDEY|Exercise Level 2 Subjective|9 Videos

Similar Questions

Explore conceptually related problems

The mean rotational kinetic energy of a diatomic molecule at temperature T is :

Which one of the following graphs represents the variation of maximum kinetic energy (E_K) of the emitted electrons with frequency u in photoelectric effect correctly ?

For a simple harmonic oscillator moving along a straight line, the graphs which represent the variation of kinetic energy K, potential energy U and total energy T with displacement are

At a constant pressure, of the following graphs that one which represents the variation of the density of an ideal gas with the absolute temperature T, is

which of the following graph represents the variation of resistivity ( rho ) with temperature (T) for copper?

The correct graph which shows the variation of paramagnetic susceptibility S with temperature T is

A body moves from rest with a constant ac- celeration. Which of the following graphs represents the variation of its kinetic energy (E) with distance travelled (x)?

A body moves from rest with a constant acceleration. Which one of the following graphs represents the variation of its kinetic energy K with the distance travelled x?

The potential energy U(x) of a particle moving along x- axis is shown in figure. Which one of the following graphs represents the variation of kinetic energy of this particel if its total mechanical enery is E_(0)

DC PANDEY-THERMOMETRY THERMAL EXPANSION AND KINETIC THEORY OF GASES-Check point 14.4
  1. The mean kinetic energy of one mole of gas per degree of

    Text Solution

    |

  2. The average translational kinetic energy of O(2) (molar mass 32) molec...

    Text Solution

    |

  3. A perfect gas at 27^(@)C is heated at constant pressure so as to tripl...

    Text Solution

    |

  4. 16 gram of oxygen, 14 gram of nitrogen and 11 gram of carbon dioxide a...

    Text Solution

    |

  5. A balloon is filled at 27^(@)C and 1 atm pressure by 500 m^(3) He. At-...

    Text Solution

    |

  6. Aperfect gas at 27^(@) C is heated at constant pressure soas to duuble...

    Text Solution

    |

  7. Figure shows graphs of pressure versus density for an ideal gas at two...

    Text Solution

    |

  8. From the p-T graph want conclusion can be drawn?

    Text Solution

    |

  9. A cylinder containe 20 kg of N(2) gas (M= 28 kg K^(-1) mol^(-1)) at a ...

    Text Solution

    |

  10. Two different isotherms representing the relationship between pressure...

    Text Solution

    |

  11. A gas is found to obey the law P^(2)V = constant. The initial temperat...

    Text Solution

    |

  12. A gas has volume V and pressure p. The total translational kinetic ene...

    Text Solution

    |

  13. A vessel contains a mixture of one of oxygen and two moles of nitrogen...

    Text Solution

    |

  14. Two monoatomic gases are at absolute temperatures 300 K and 350 K res...

    Text Solution

    |

  15. At 27^(@)C temperature, the kinetic energy of an ideal gas is E(1^.) I...

    Text Solution

    |

  16. Temperature remaining constant, the pressure of gas is decreased by 20...

    Text Solution

    |

  17. One litre of an ideal gas st 27^(@)C is heated at a constant pressure ...

    Text Solution

    |

  18. In the given (V-T) diagram, what is the relation between pressure P(1)...

    Text Solution

    |

  19. The gas in a vessel is subjected to a pressure of 20 atmosphere at a t...

    Text Solution

    |

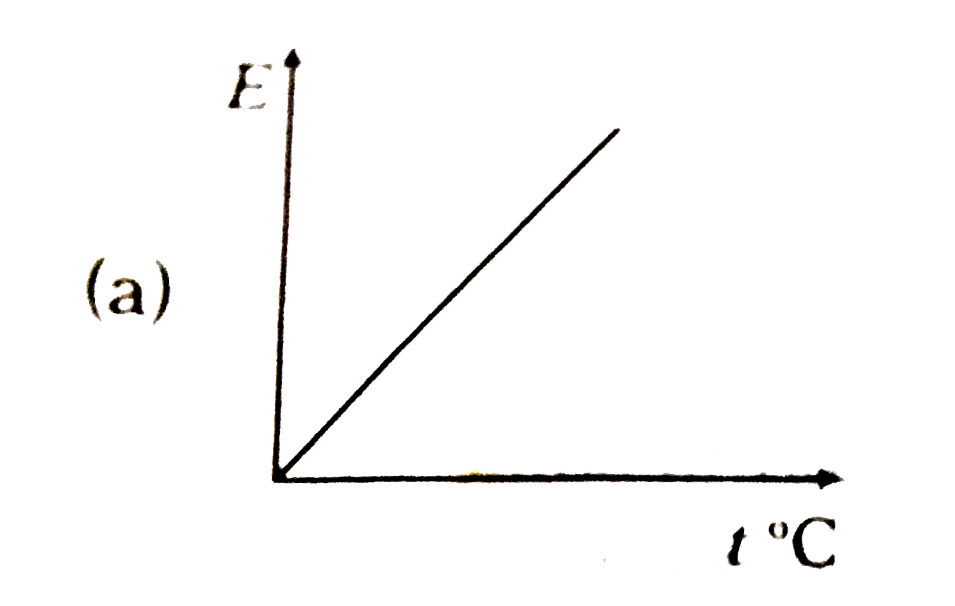
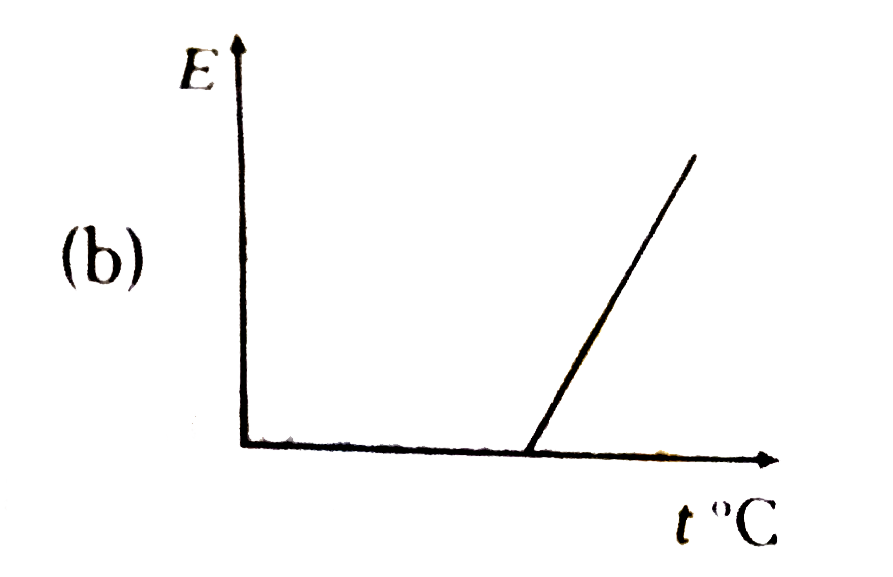
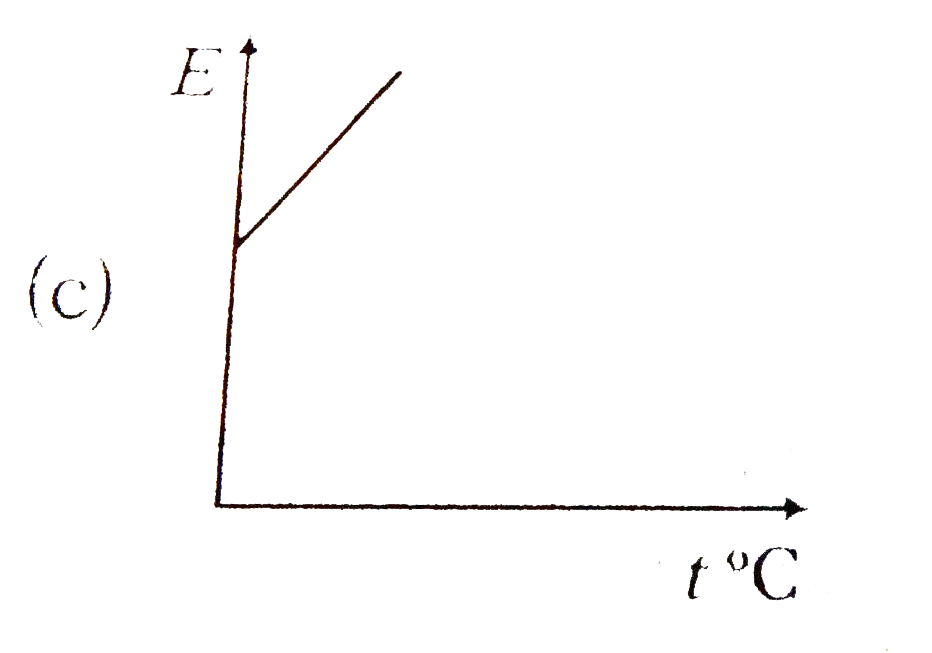
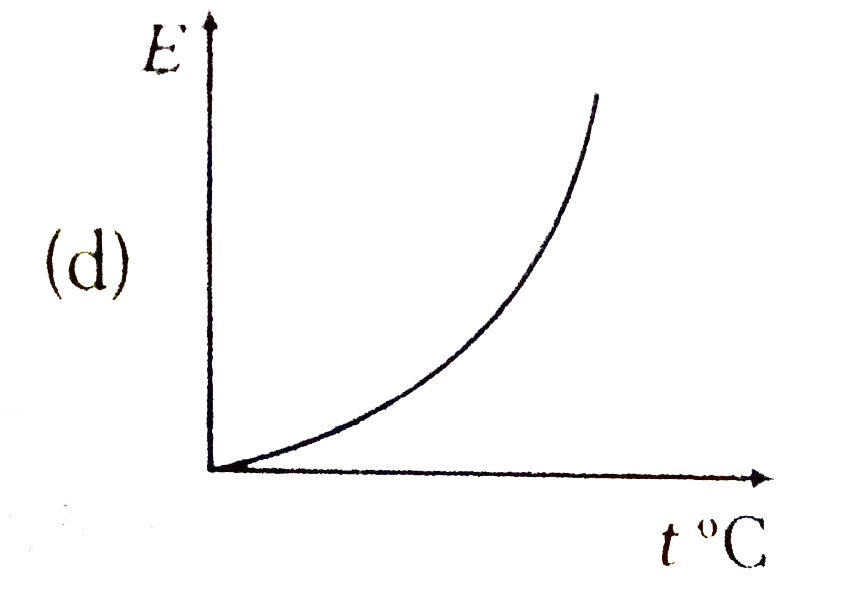
  20. The graph which represents the variation of mean kinetic energy of mol...

    Text Solution

    |