A
B
C
D
Text Solution
Verified by Experts
The correct Answer is:


Similar Questions
Explore conceptually related problems
Recommended Questions
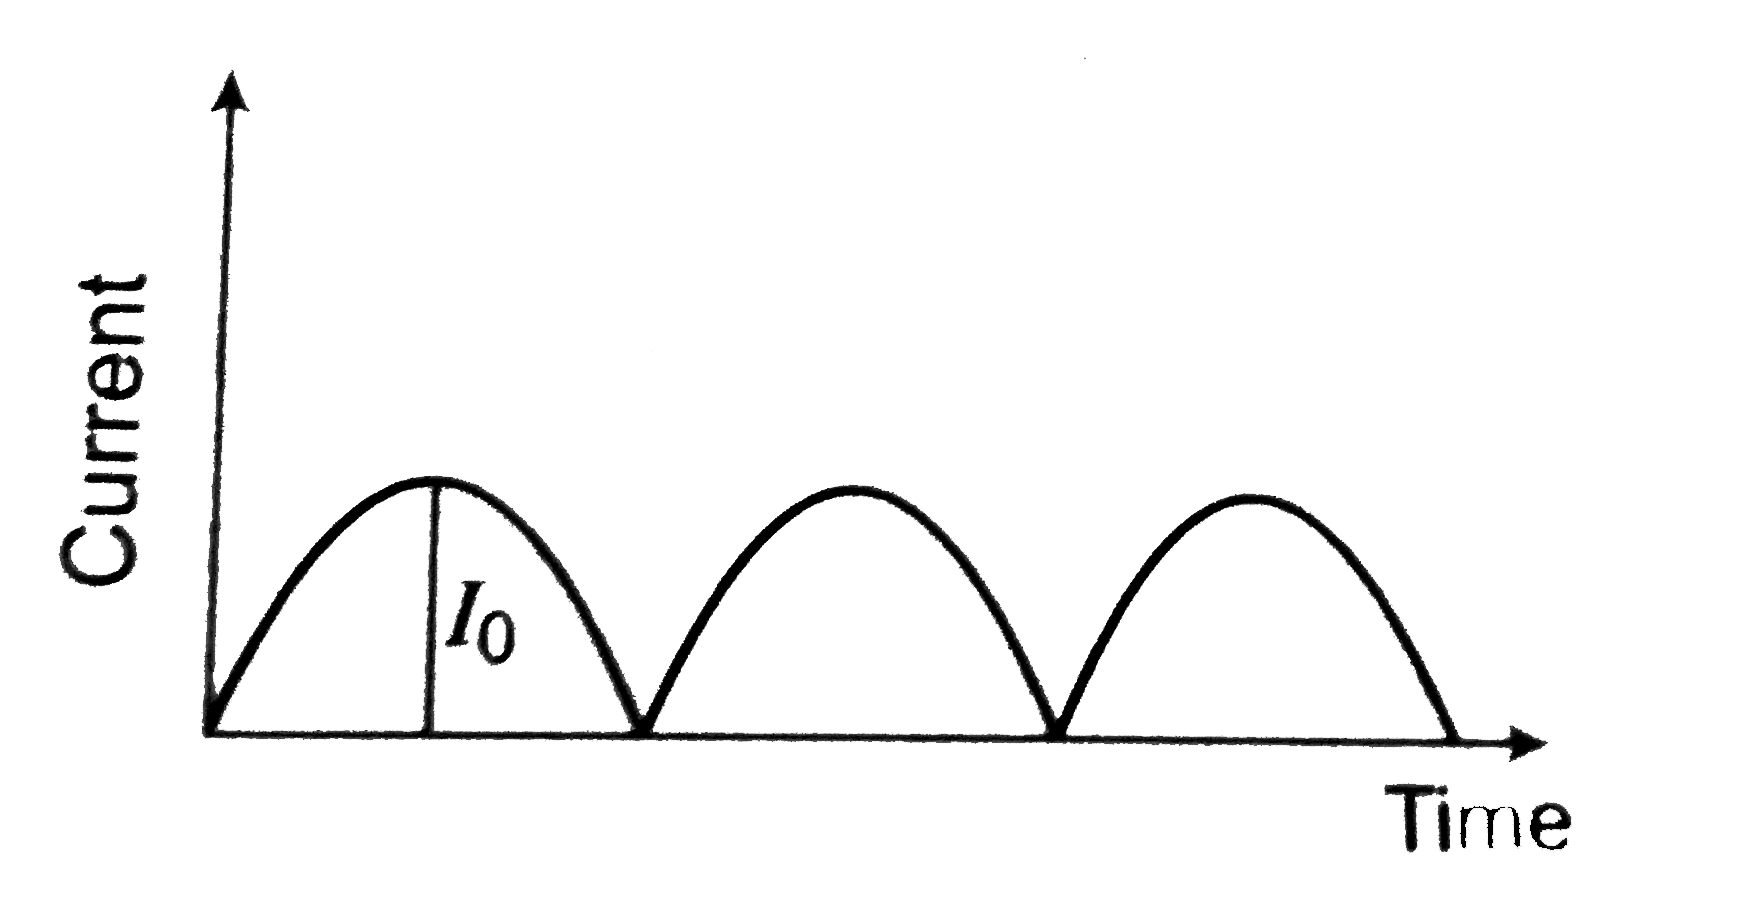
- The output current versus time curve of a rectifire is shown in the fi...
Text Solution
|
- In a step-down transformer the turn ratio is 1:2 and output power is 2...
Text Solution
|
- The output current versus time curve of a rectifire is shown in the fi...
Text Solution
|
- In the circuit shown in figure the maximum output voltage V(0) is
Text Solution
|
- For the circuit shown in figure, Find (1) the output voltage , (2)...
Text Solution
|
- A full wave rectifier circuit along with the input and output voltages...
Text Solution
|
- Assertion: Current versus time graph is as shown in figure, rms value ...
Text Solution
|
- What is the value of output voltage V(0) in the circuit shown in the f...
Text Solution
|
- What is the value of output voltage V0 in the circuit shown in the fig...
Text Solution
|