A
B
C
D
Text Solution
Verified by Experts
The correct Answer is:


Similar Questions
Explore conceptually related problems
Recommended Questions
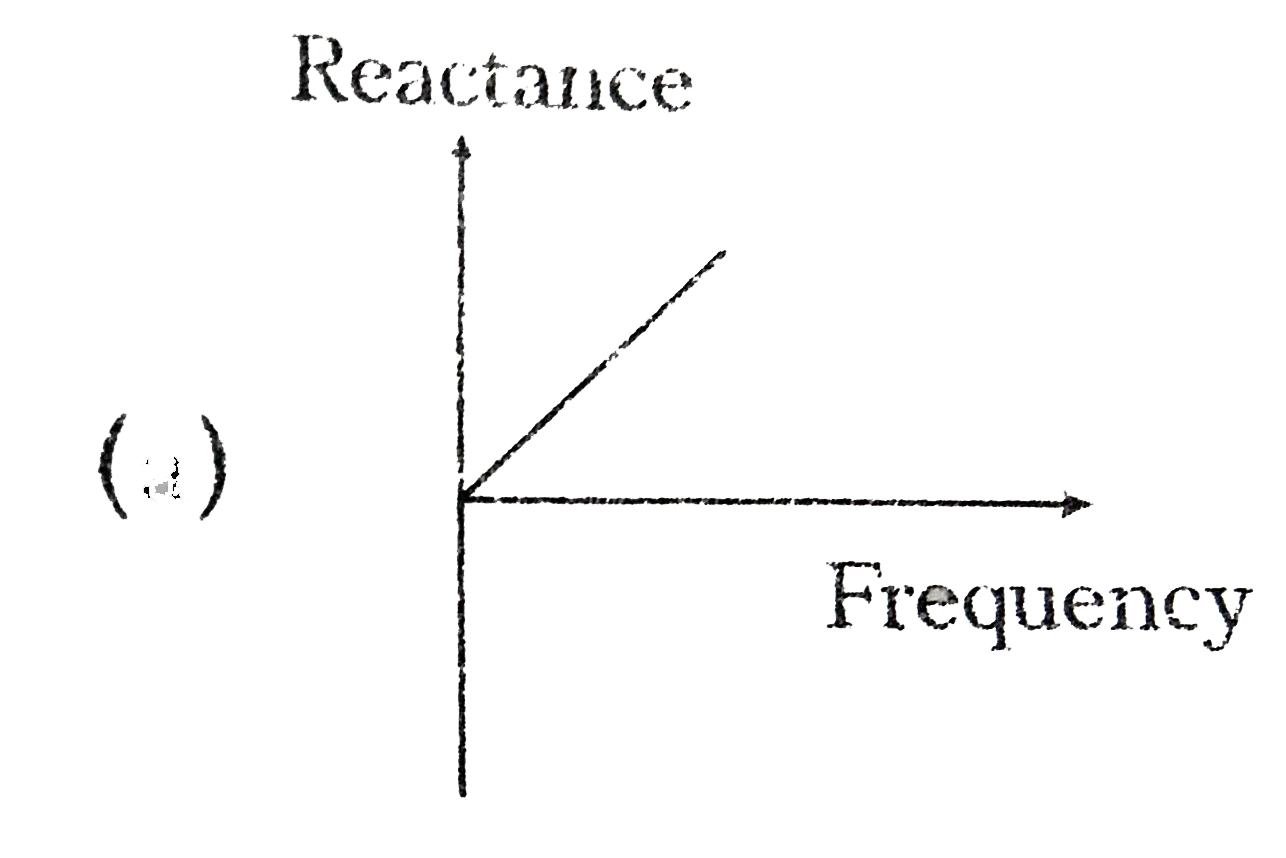
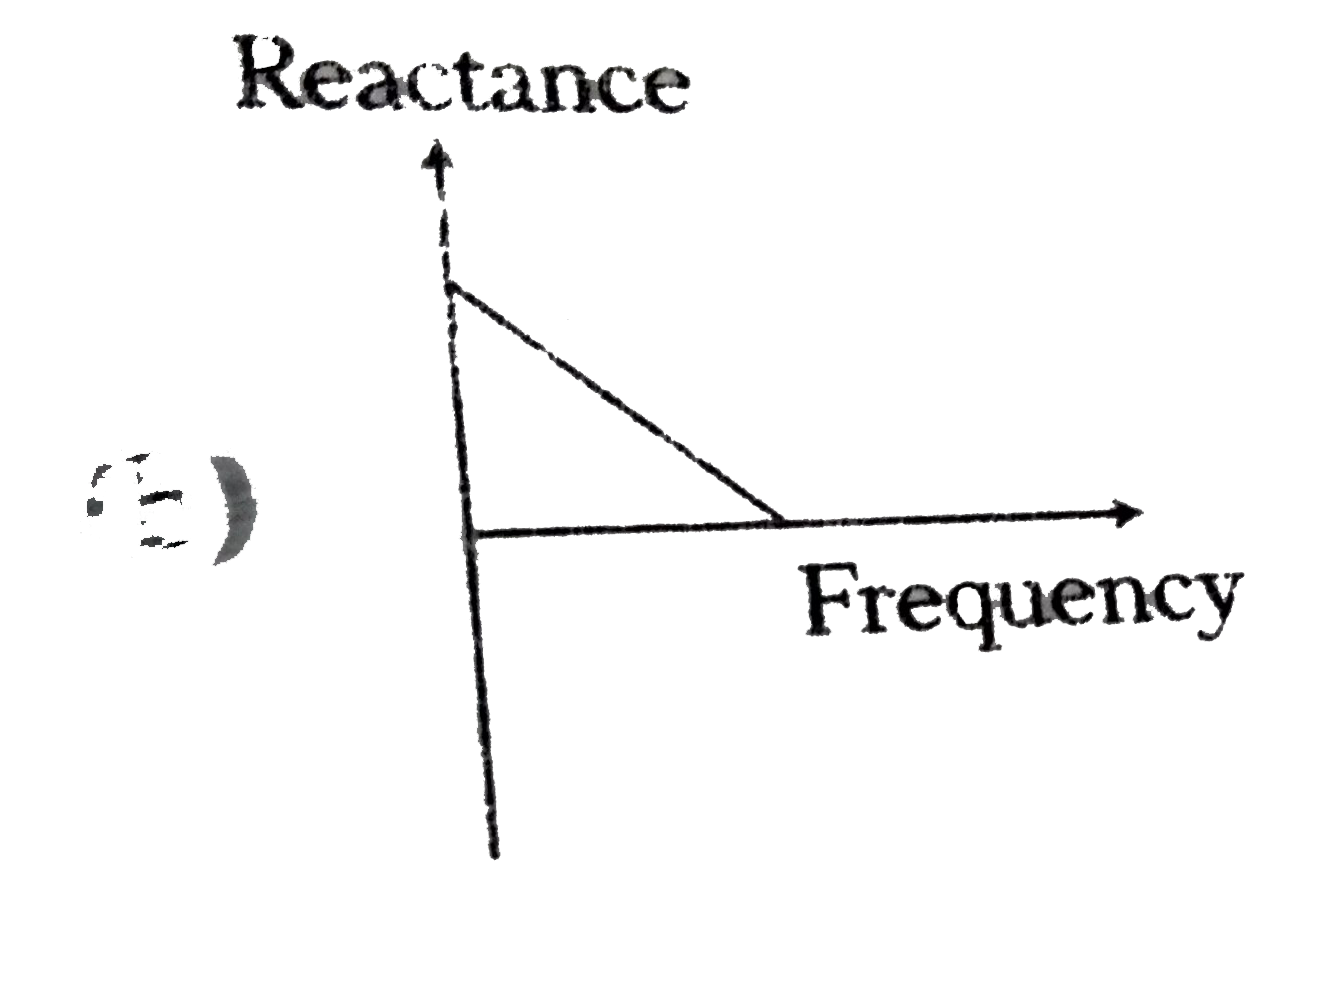
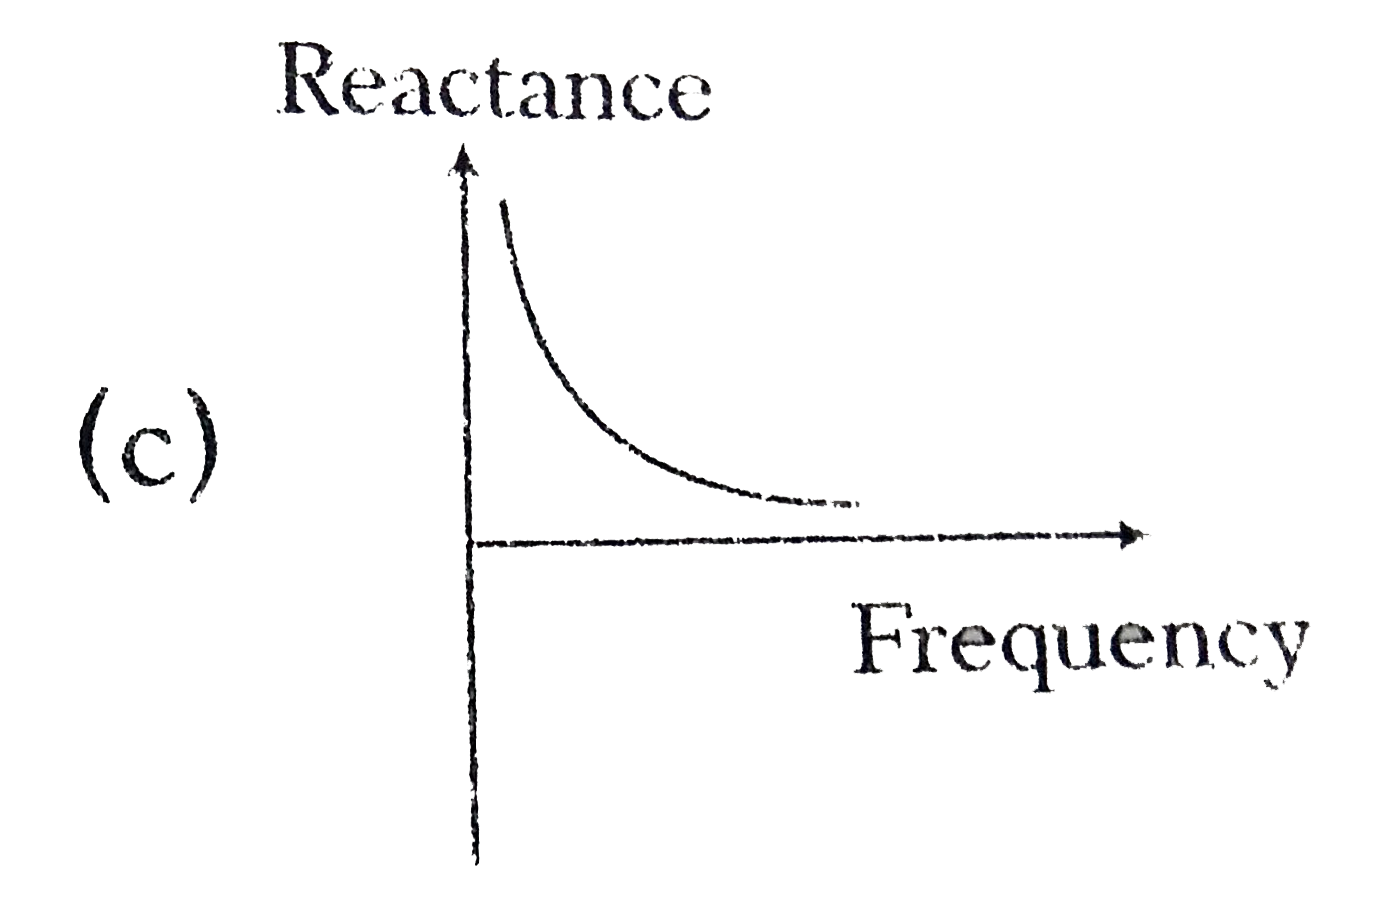
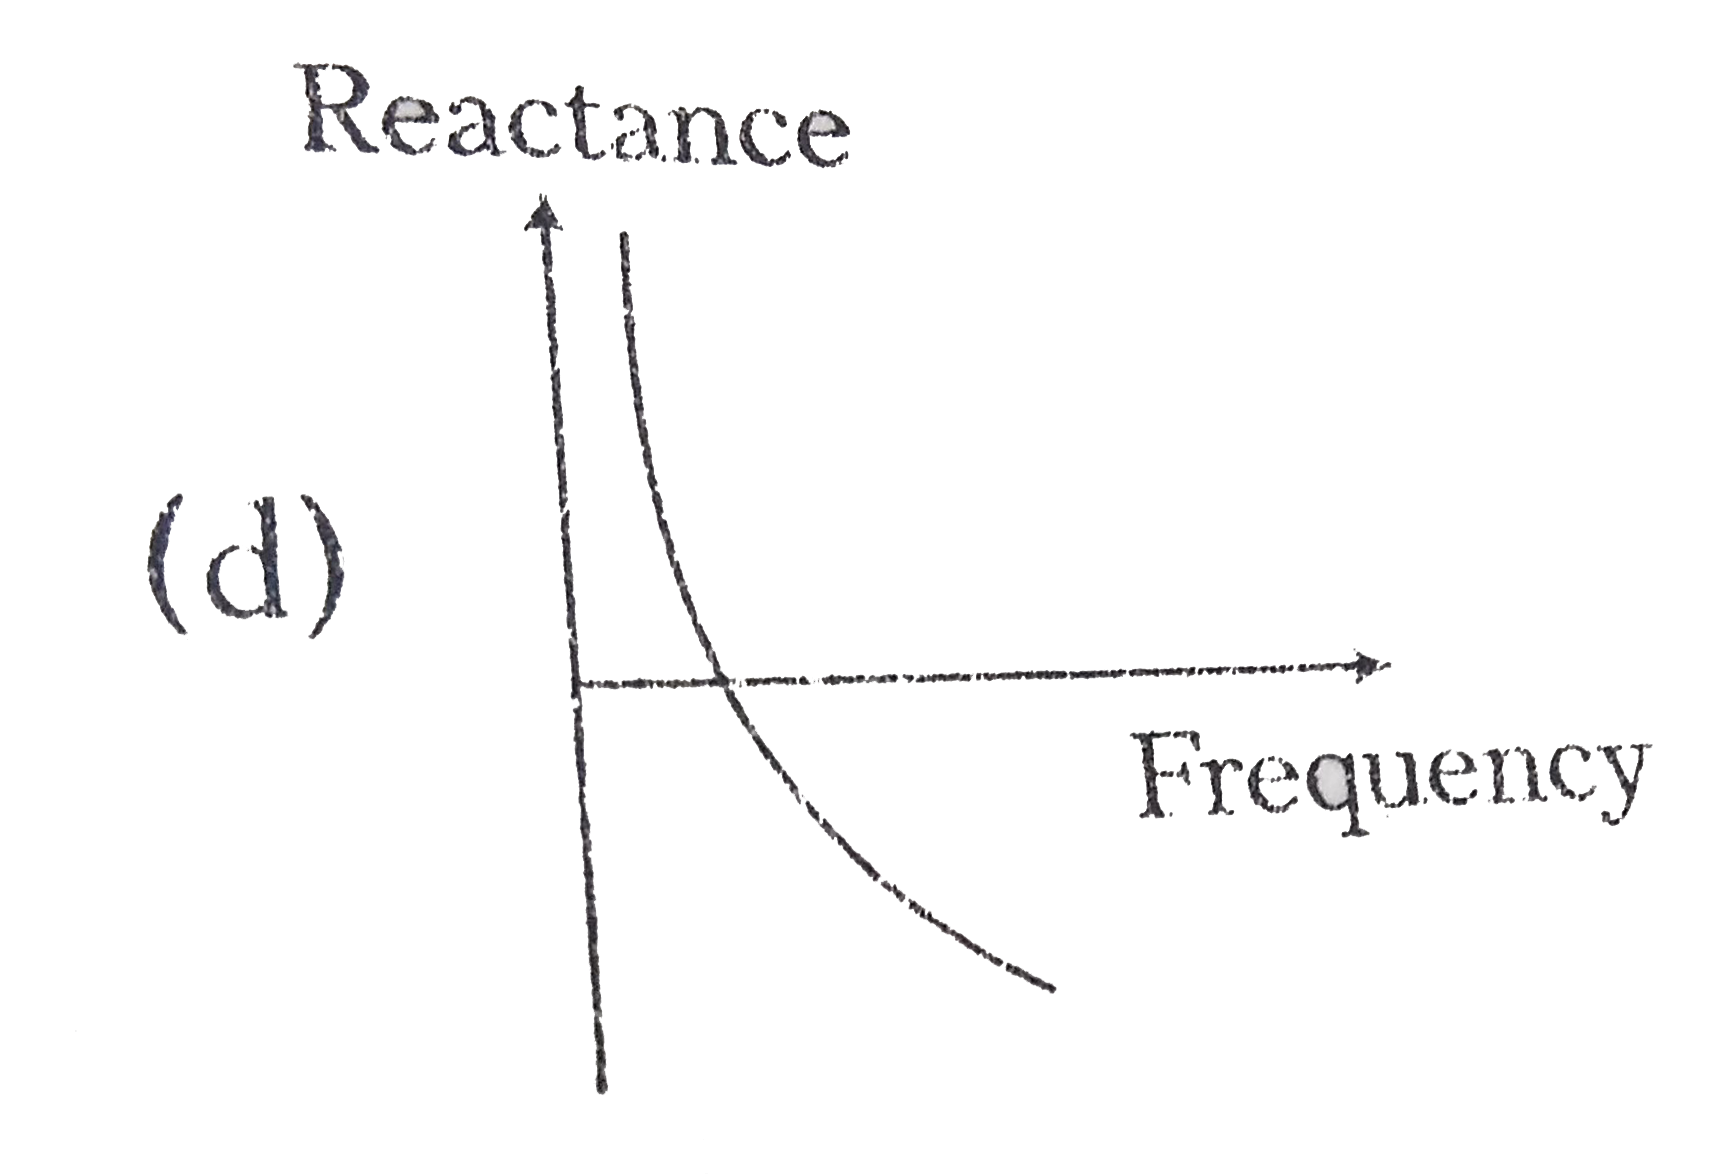
- Which of the shown graphs may represent the reactance of a series L-C ...
Text Solution
|
- The V - I graphs for two resistors and their series combination are sh...
Text Solution
|
- The V-I graphs of parallel and series combinations of two metallic res...
Text Solution
|
- Which of the following plots may represent the reactance of a series L...
Text Solution
|
- Current-voltage characteristics of two elements A and B are as shown b...
Text Solution
|
- Which of the following plots may represent is impedence of a series LC...
Text Solution
|
- Which of the following graphs represent the correct variation of induc...
Text Solution
|
- Which of the shown graphs may represent the reactance of a series L-C ...
Text Solution
|
- L,C,R represents the inductance, capacitance and reactance respectivel...
Text Solution
|