


Similar Questions
Explore conceptually related problems
Recommended Questions
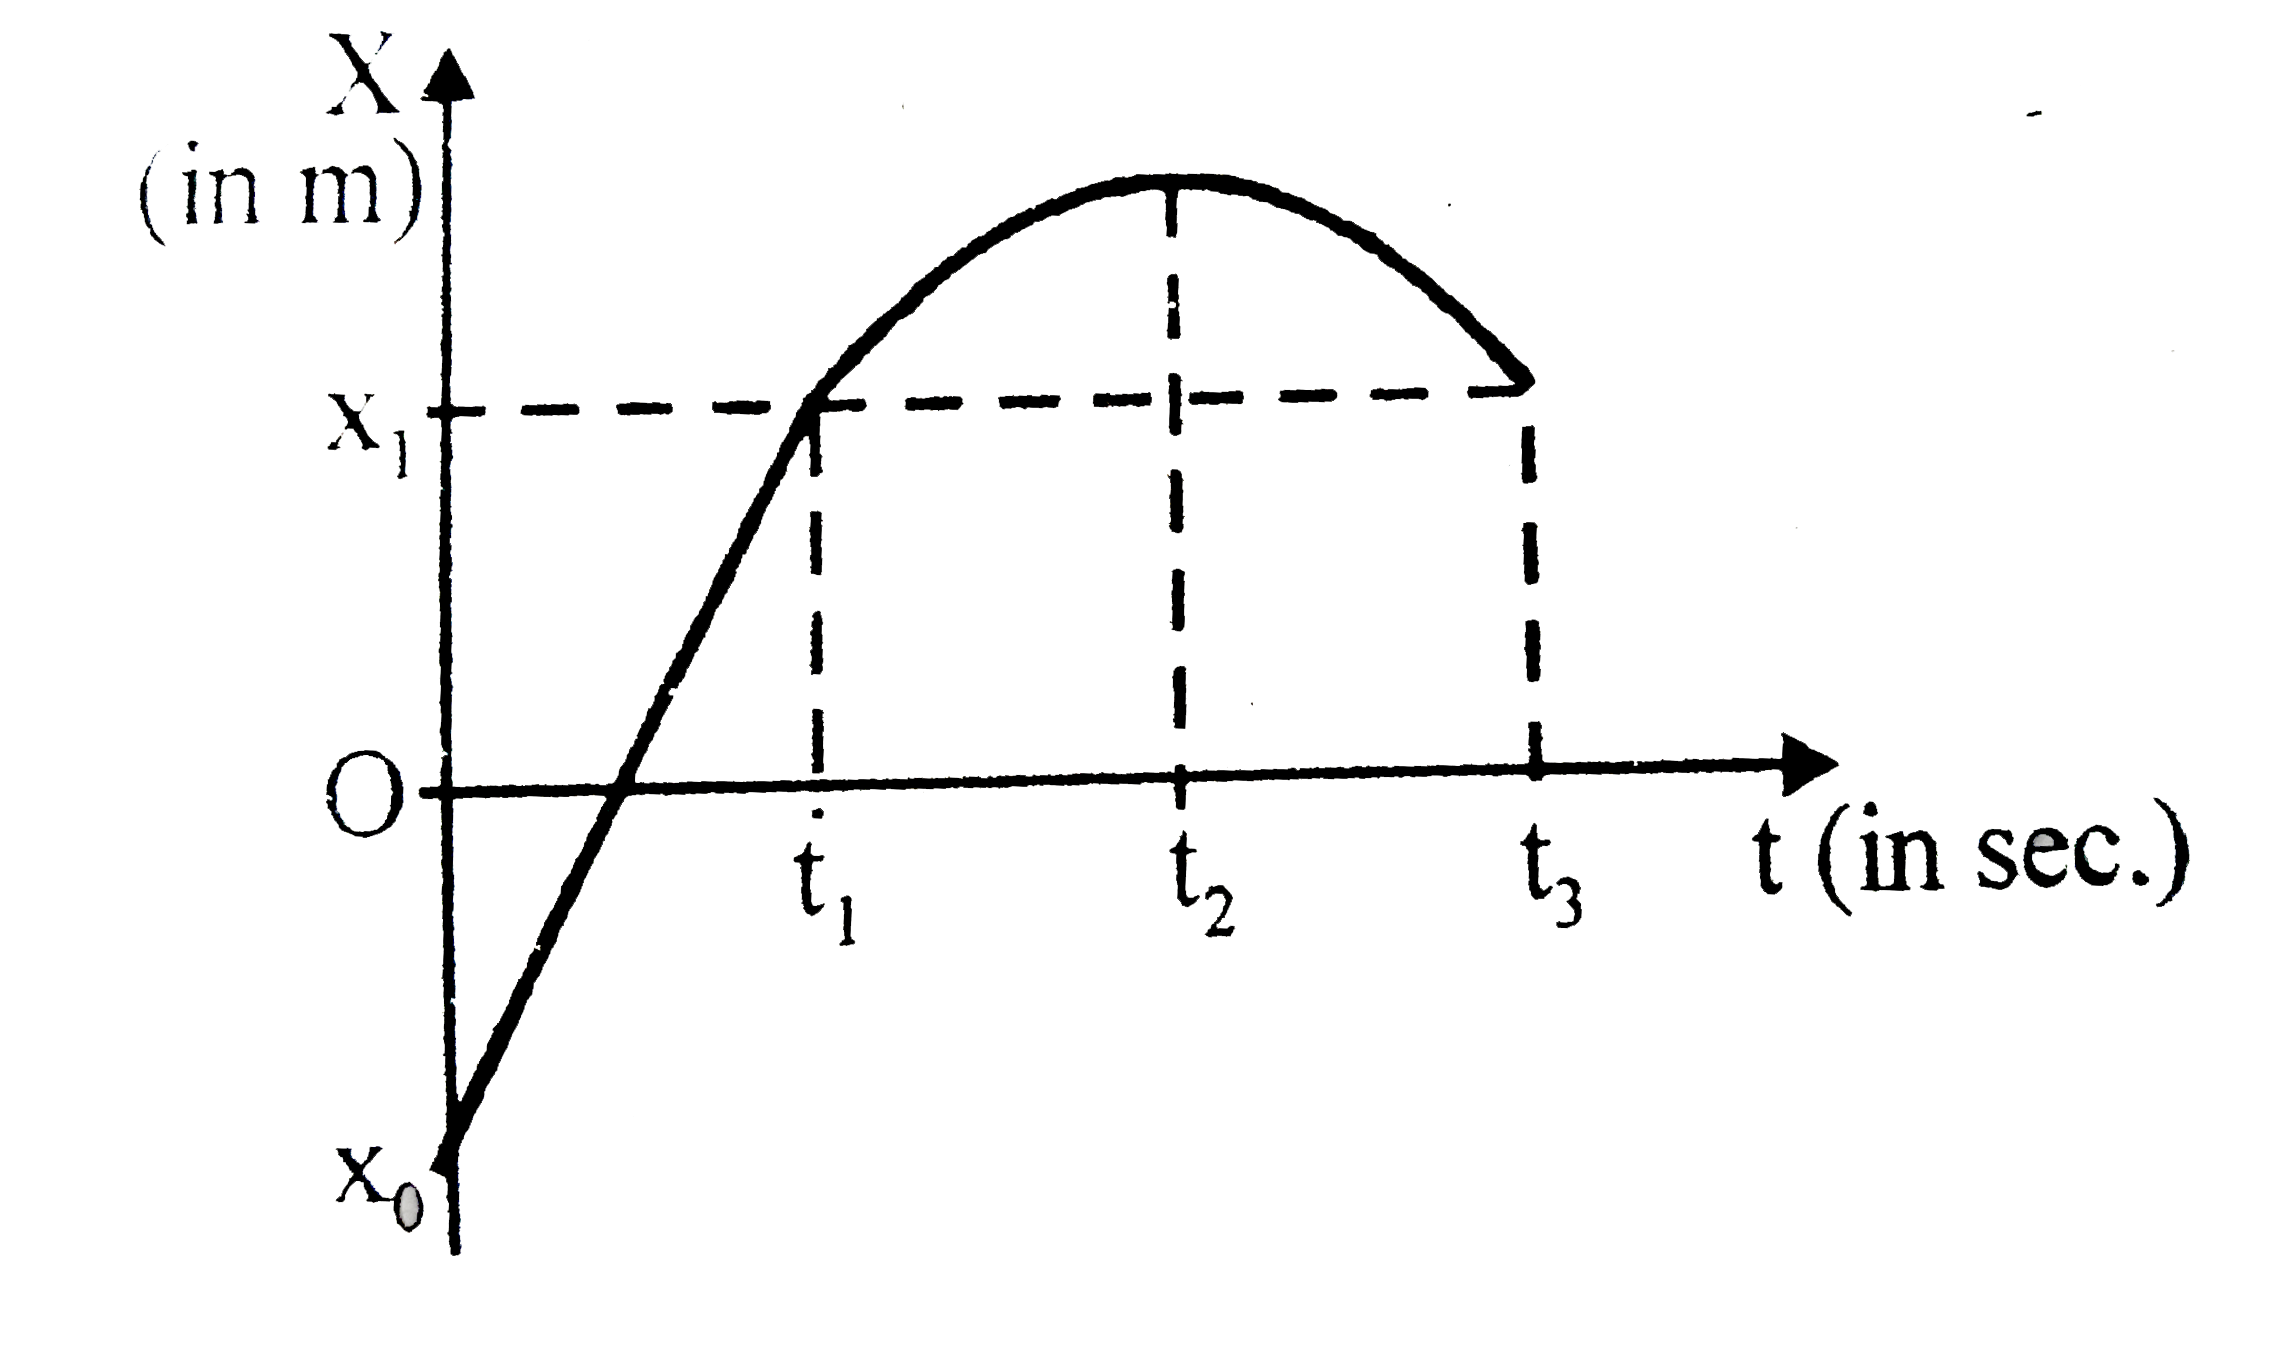
- Figure is given a plot of the cooordinate of the body against time. Fr...
Text Solution
|
- Shown below are the black body radiation curves at temperature T(1) an...
Text Solution
|
- The population of active nuclei in a sample of radioactive isotope has...
Text Solution
|
- Figure is given a plot of the cooordinate of the body against time. Fr...
Text Solution
|
- The V - i graph for a conductor at temperature T(1) and T(2) are as sh...
Text Solution
|
- The product of PV is plotted against P at two temperatures T(1) and T(...
Text Solution
|
- The plots of intensity of radiation versus wavelength of 3 black bodie...
Text Solution
|
- Find T(1) and T(2) in the given figure .
Text Solution
|
- एक विमीय गति में किसी कण का वेग - समय ग्राफ चित्र 3.62 में दिखाया गया ...
Text Solution
|