 .
.


Similar Questions
Explore conceptually related problems
Recommended Questions
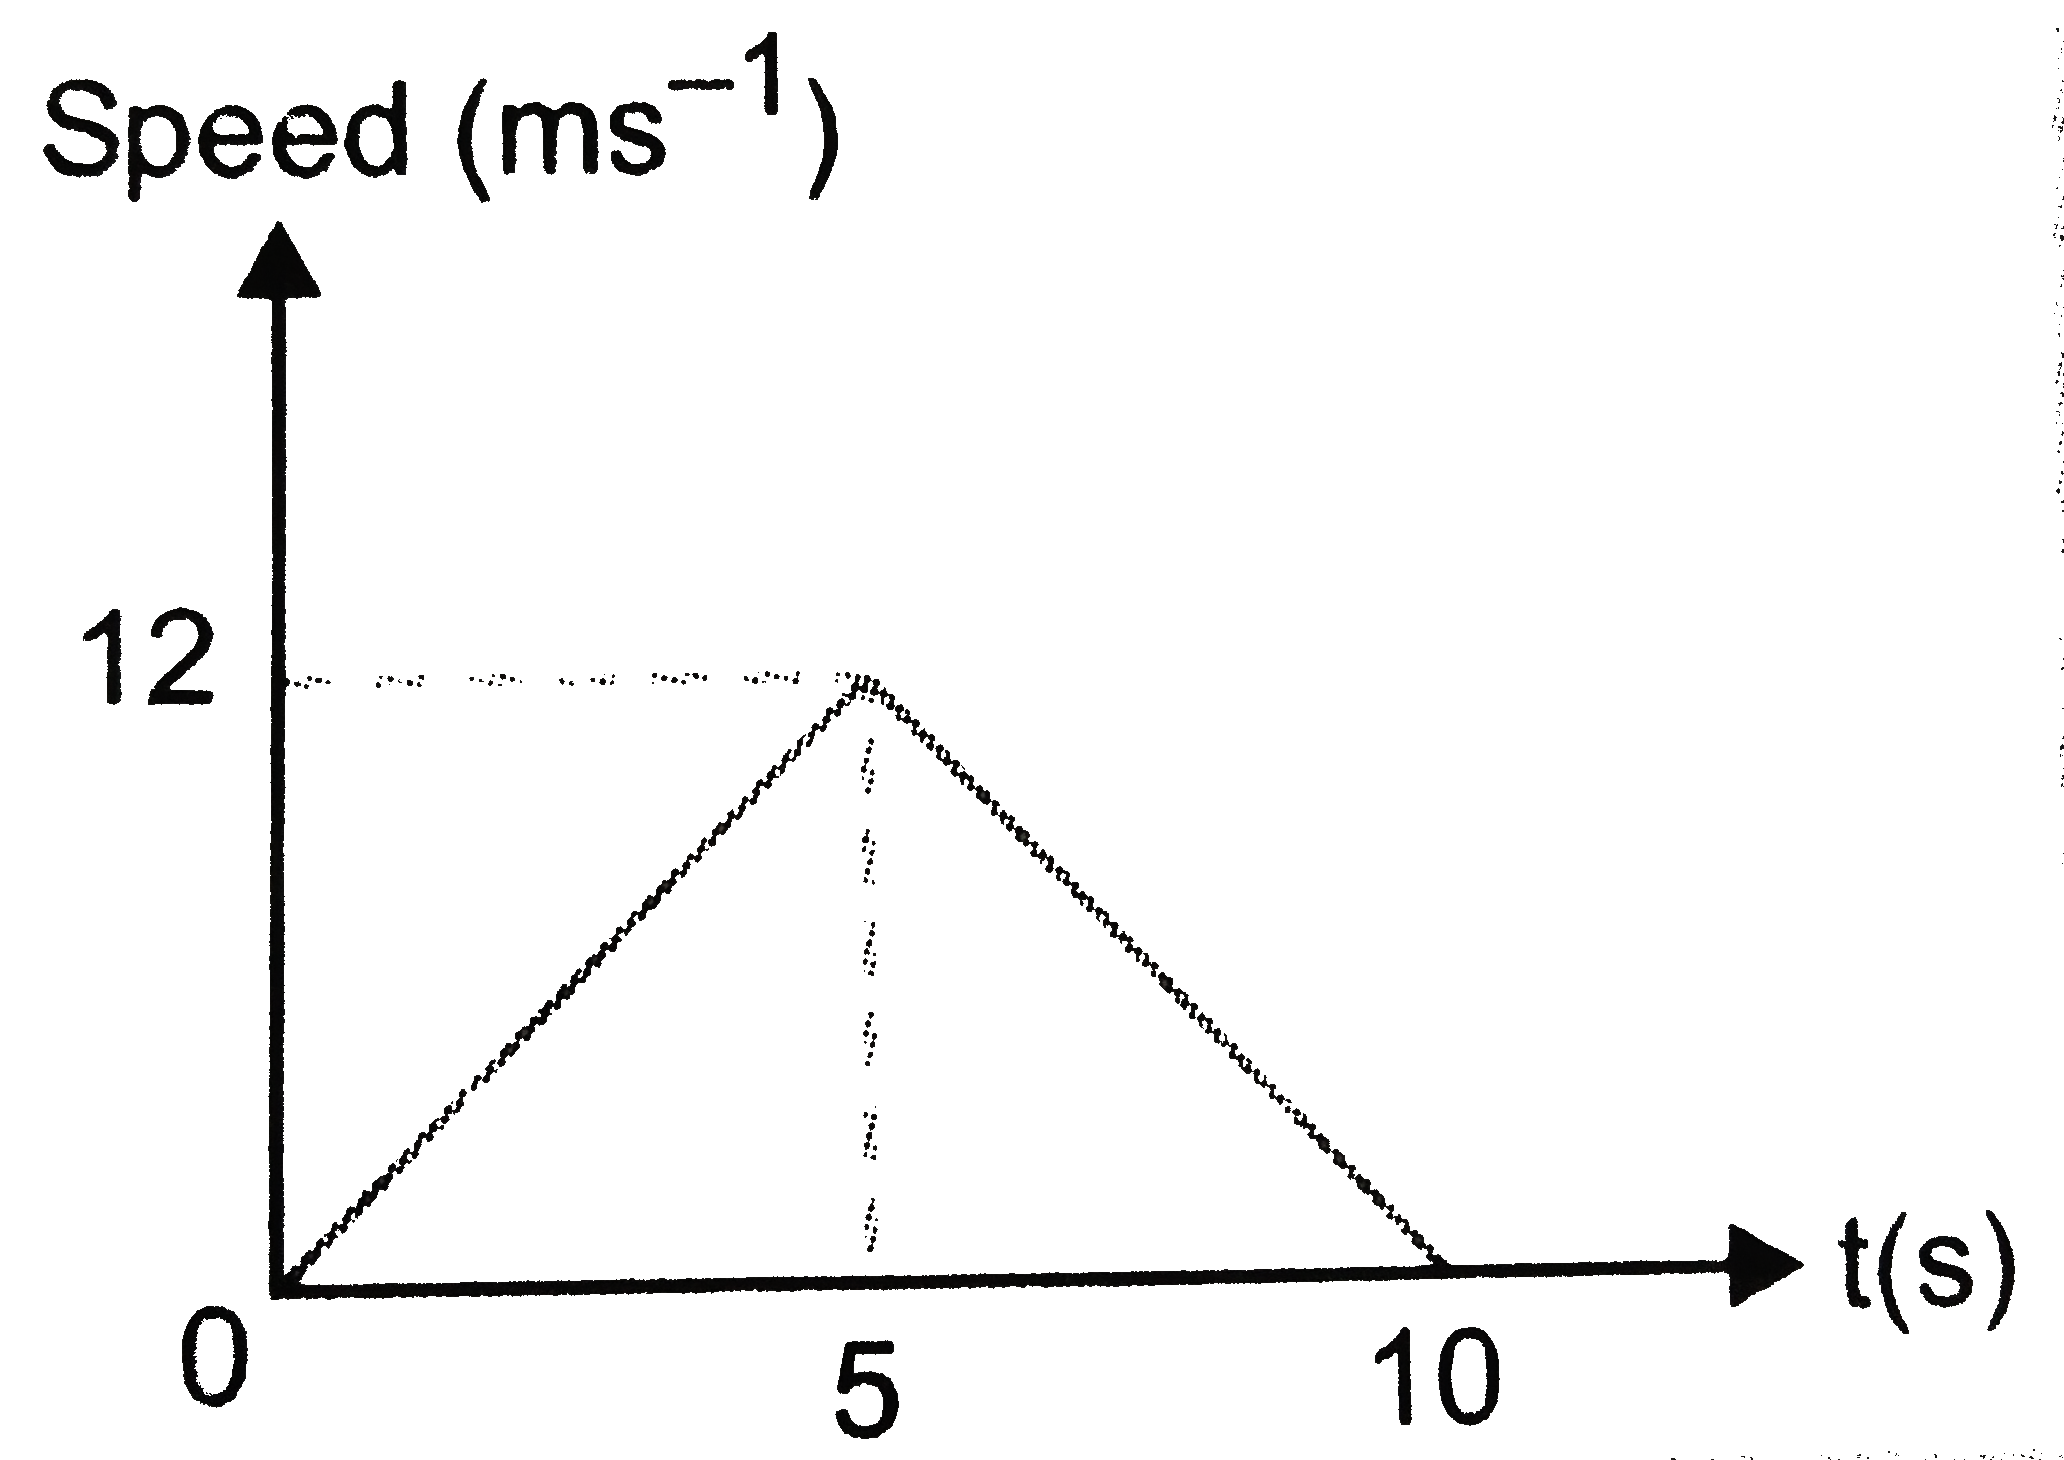
- The speed -time graph of a particle moving along a fixed direction id ...
Text Solution
|
- The speed -time graph of a particle moving along a fixed direction id ...
Text Solution
|
- The speed-time graph of a particle moving along a fixed direction is s...
Text Solution
|
- The speed-time graph of a particle moving along a fixed direction as s...
Text Solution
|
- Position-time graph of a particle in motion is shown in fig. Calculate...
Text Solution
|
- किसी निश्चित दिशा में अनुदिश चल रहे किसी कण का चाल - समय ग्राफ चित्र 3...
Text Solution
|
- The speed time graph of a particle moving along a fixed direction is a...
Text Solution
|
- The speed-time graph of a particle moving along a fixed direction is s...
Text Solution
|
- The speed-time graph of a particle moving along a fixed direction is s...
Text Solution
|