Text Solution
Verified by Experts


Topper's Solved these Questions
MEASURES OF CENTRAL TENDENCY MEDIAN AND MODE
TARUN JAIN & VK OHRI|Exercise Miscellaneous Illustrations|30 VideosMEASURES OF CENTRAL TENDENCY MEDIAN AND MODE
TARUN JAIN & VK OHRI|Exercise Objective Type Questios|26 VideosMEASURES OF CENTRAL TENDENCY - ARITHMETIC MEAN
TARUN JAIN & VK OHRI|Exercise Illustration|72 VideosMEASURES OF DISPERSION
TARUN JAIN & VK OHRI|Exercise Learning by doing|30 Videos
Similar Questions
Explore conceptually related problems
TARUN JAIN & VK OHRI-MEASURES OF CENTRAL TENDENCY MEDIAN AND MODE-NCERT Questions (With Hints to Answers)
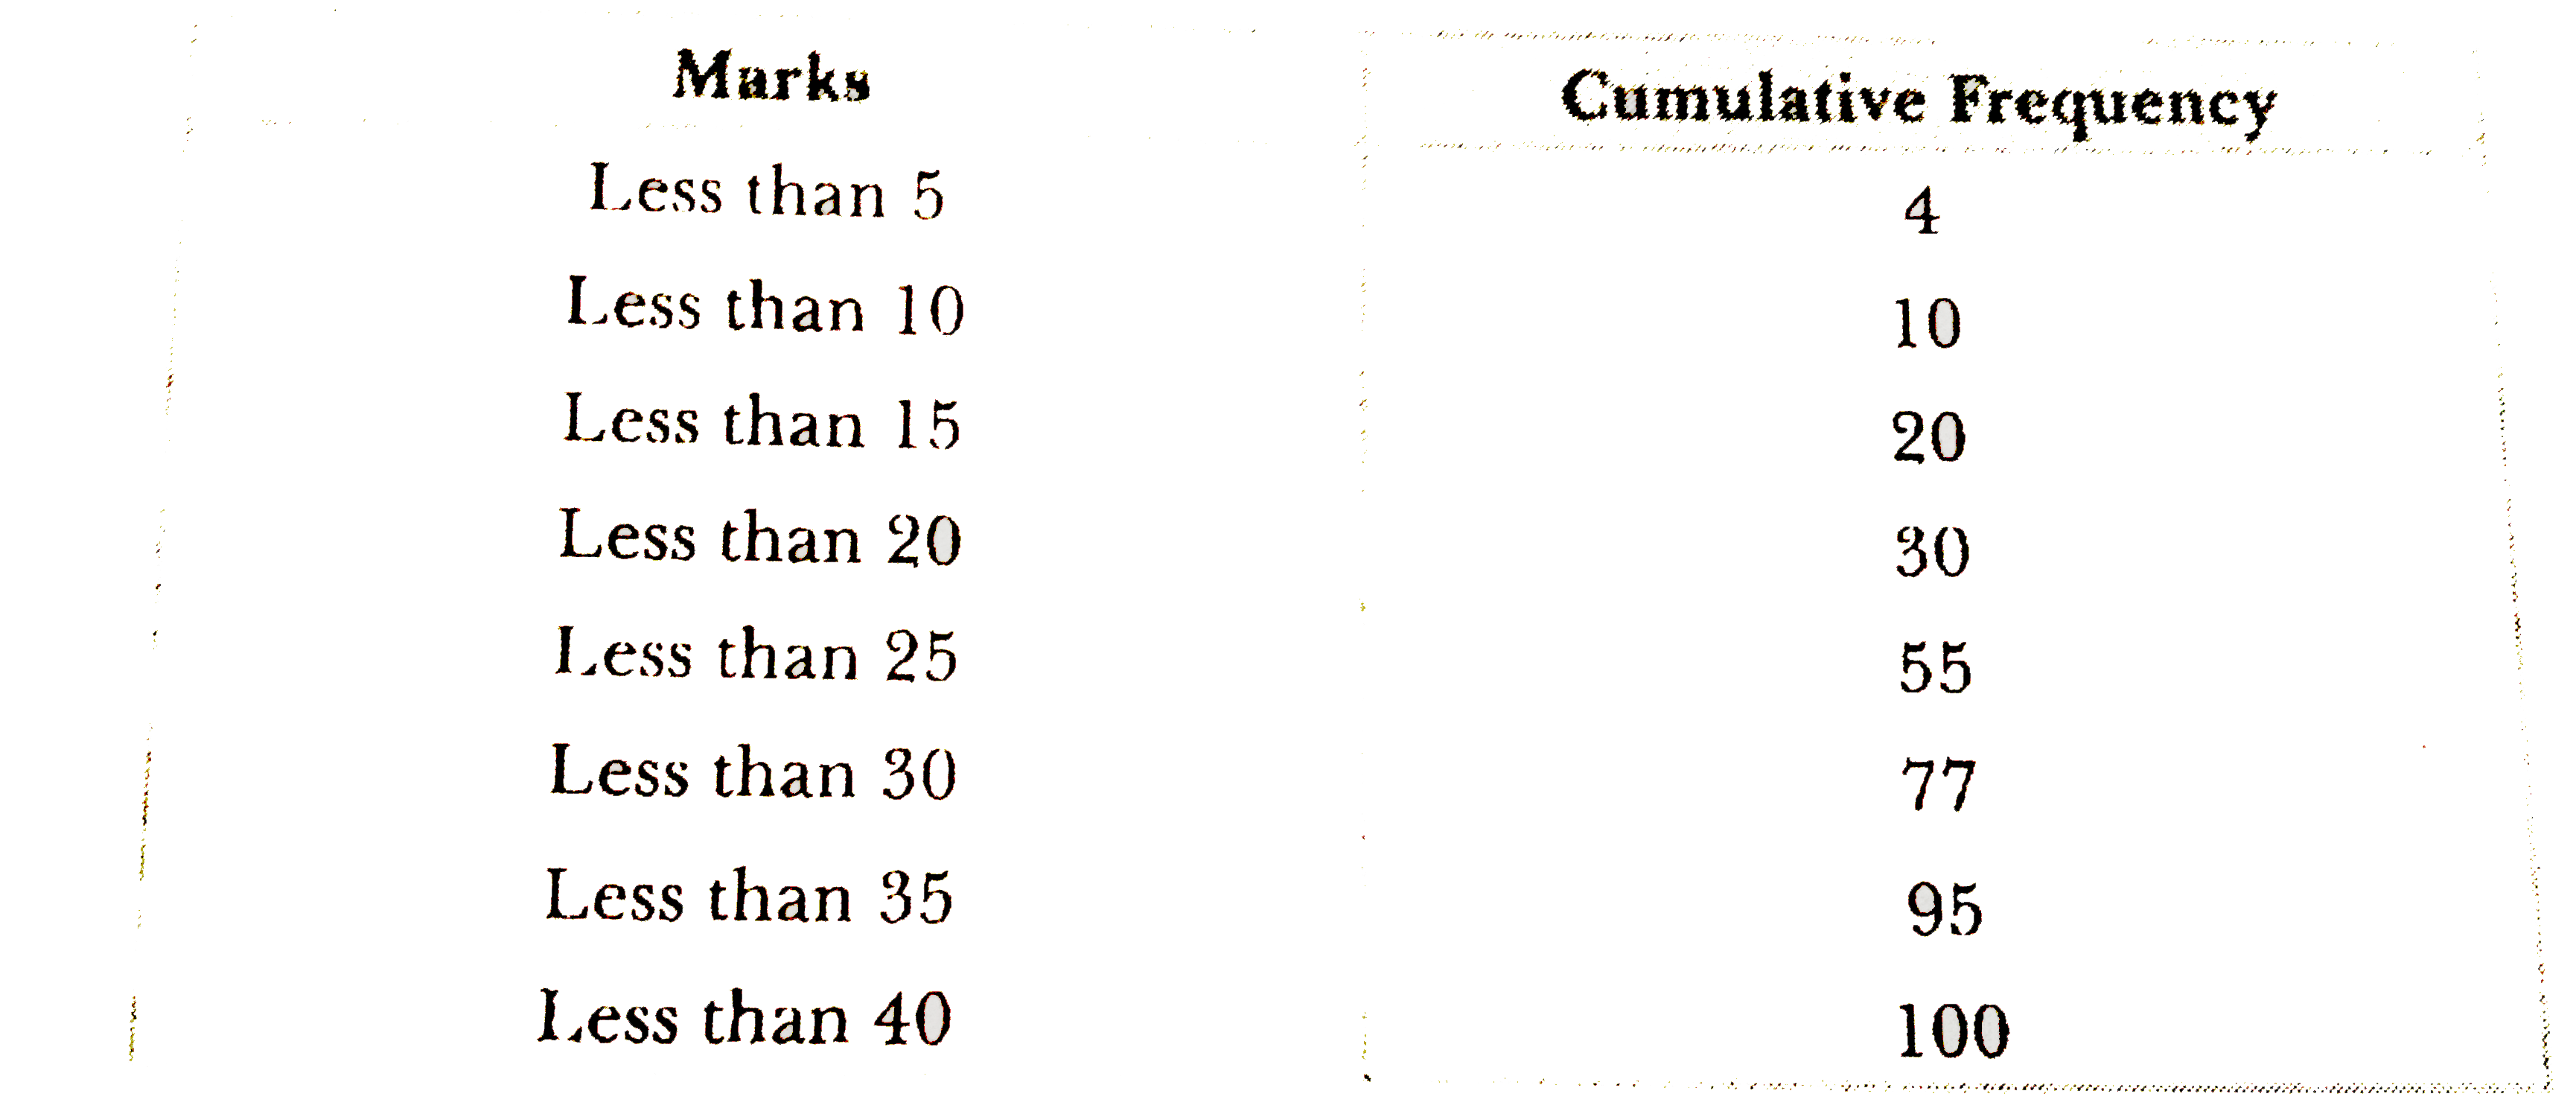
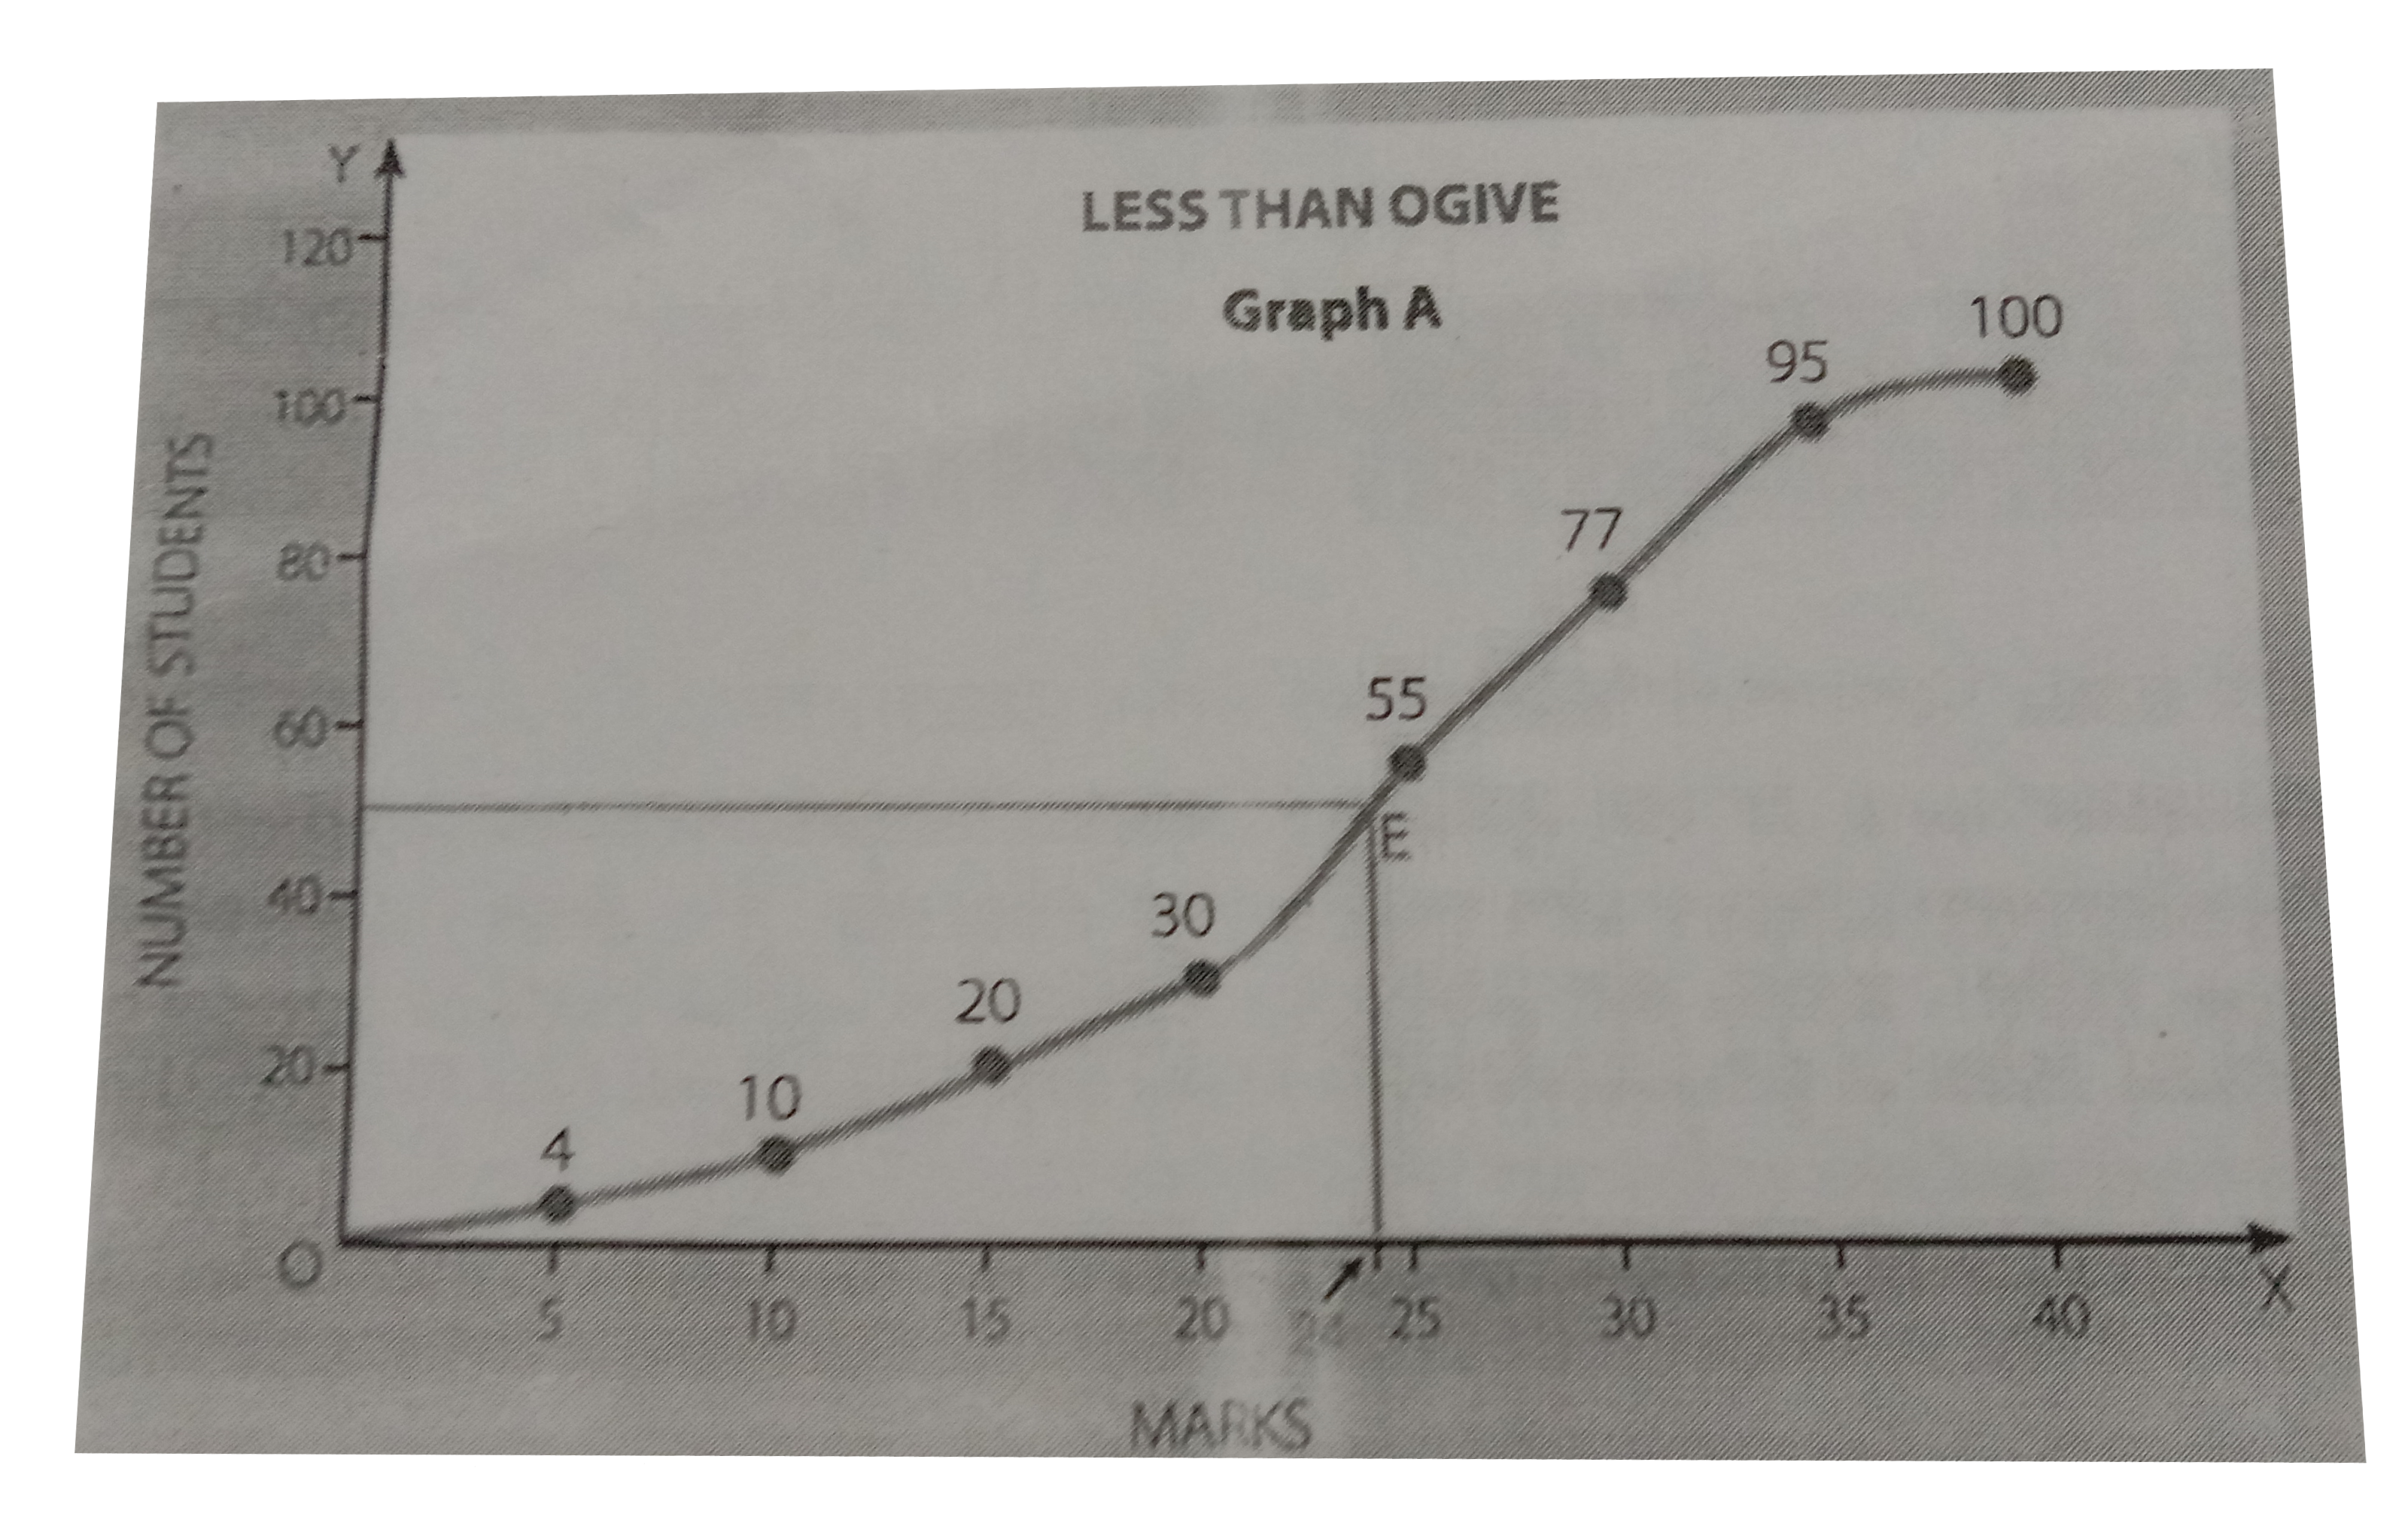
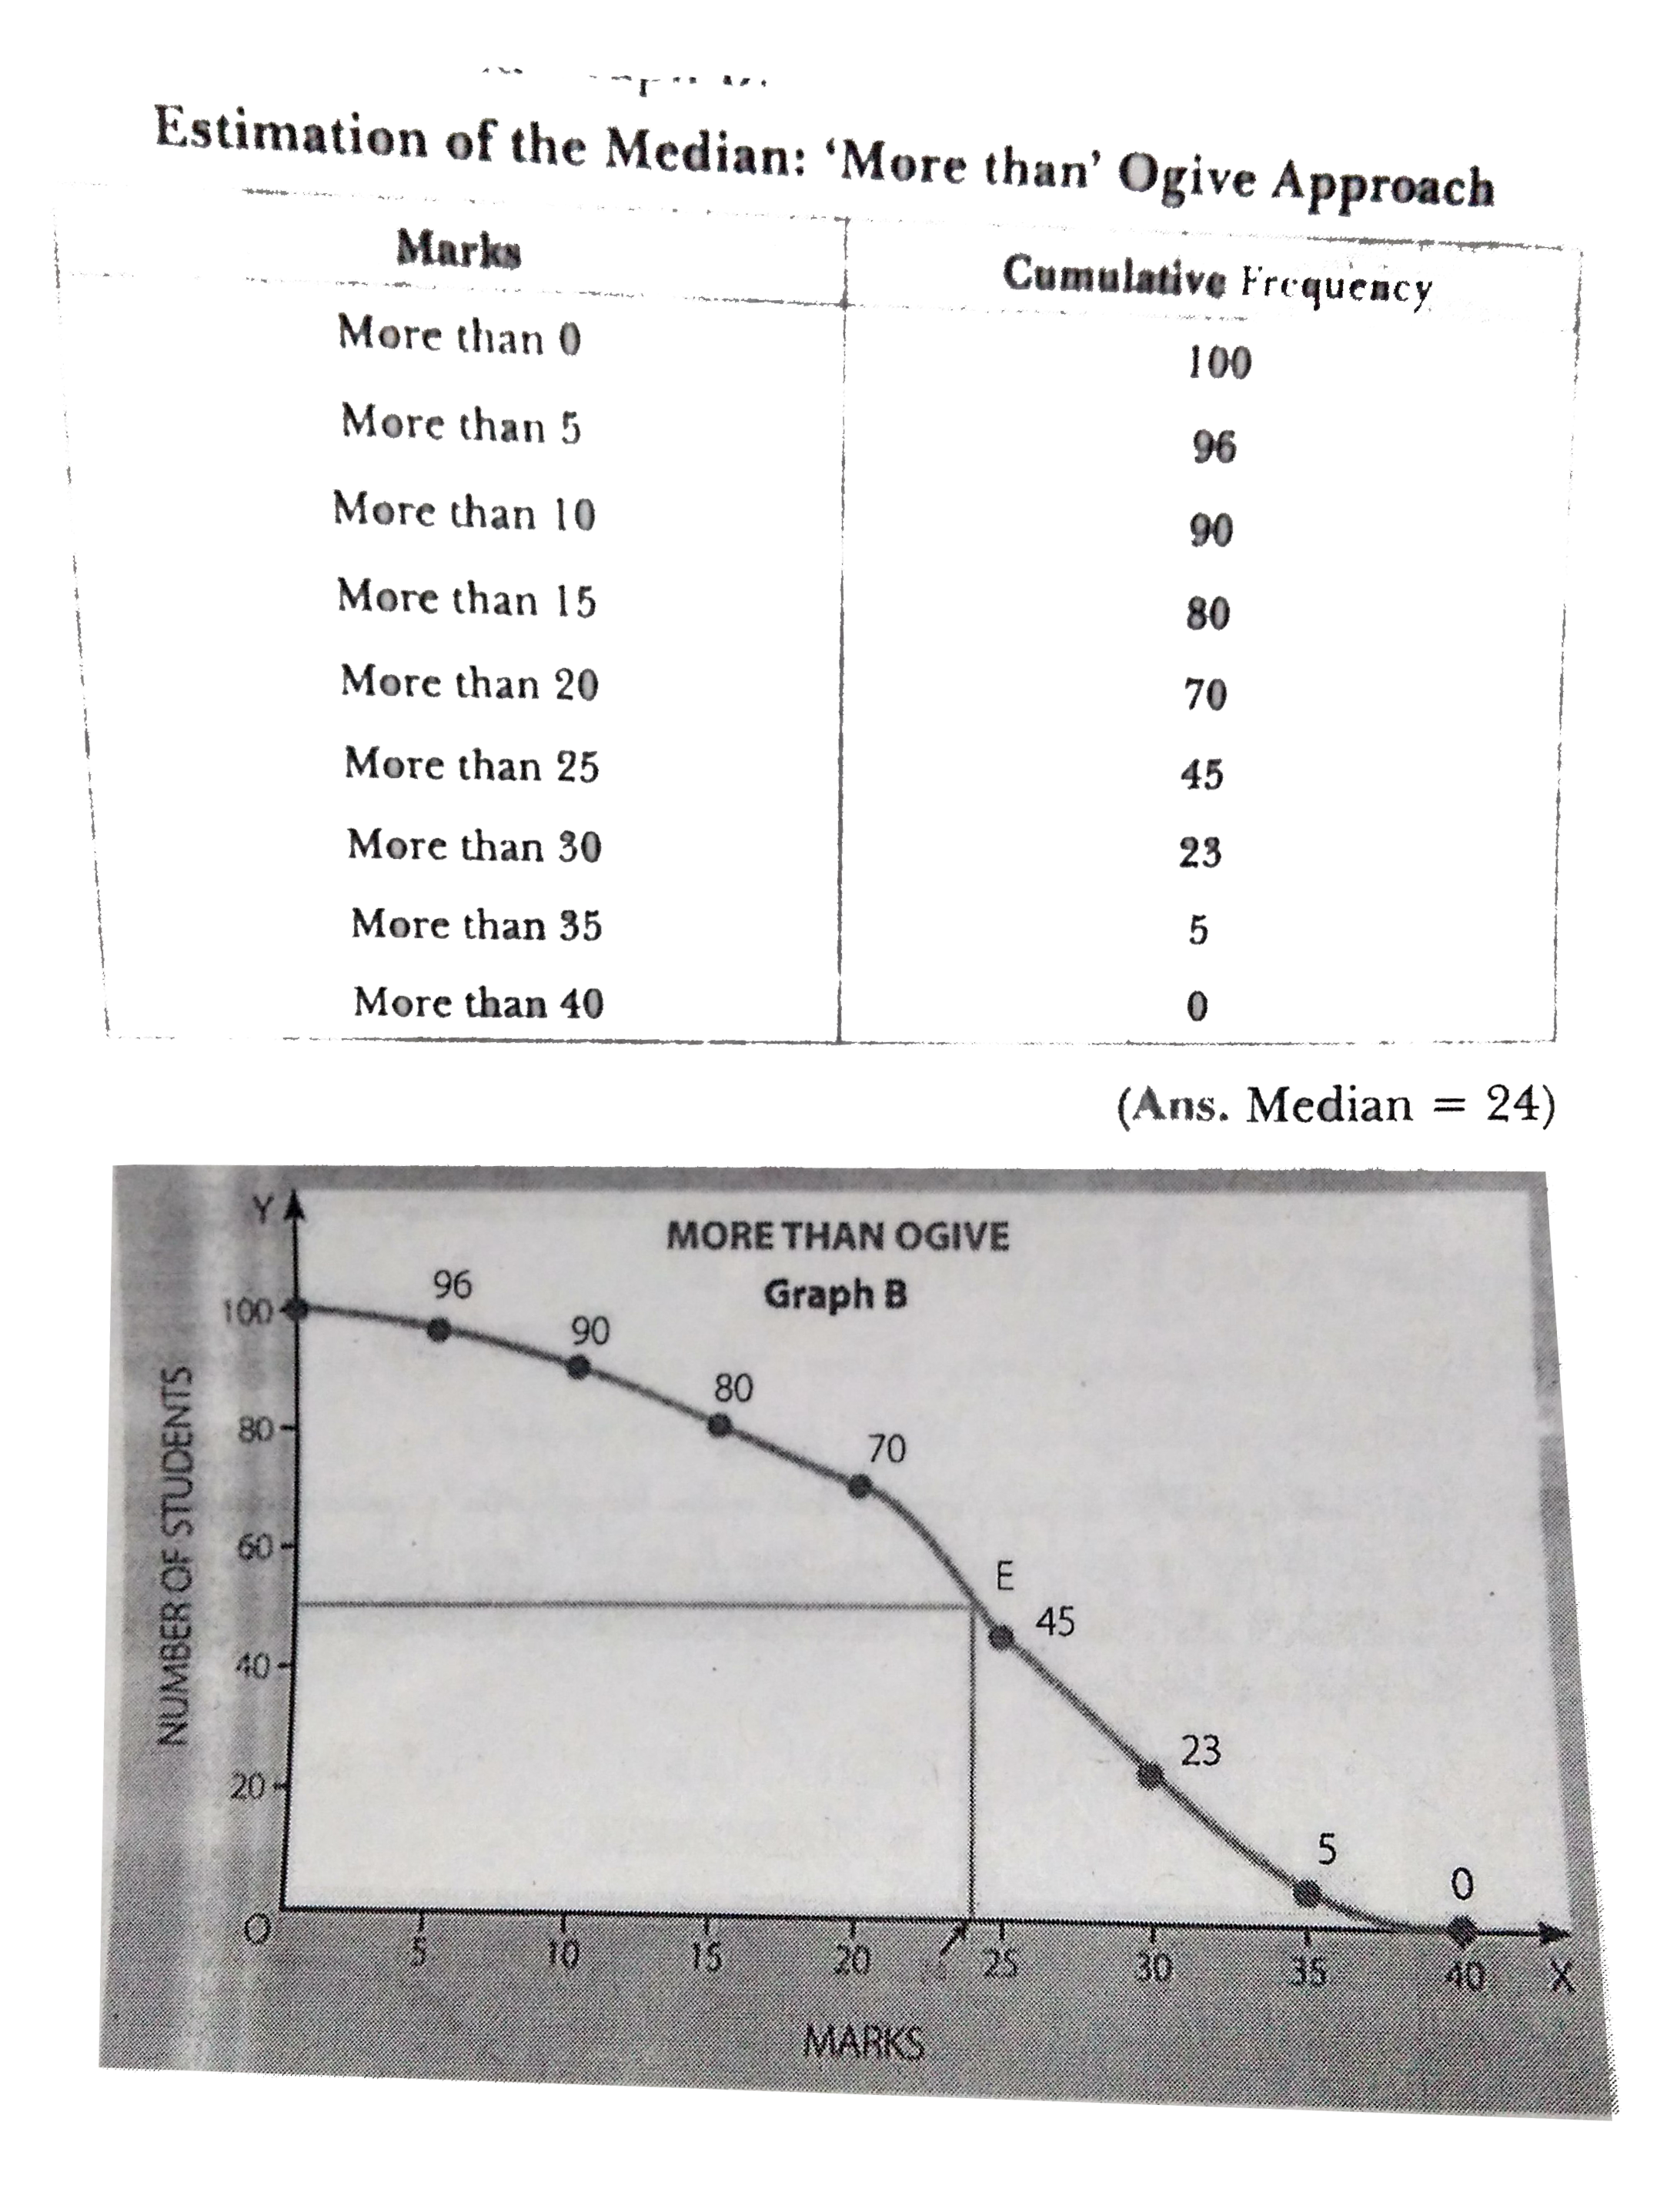
- Determine median value of the following series using graphic method : ...
Text Solution
|
- (i) The sum whether the following statements are true or false : ...
Text Solution
|
- If the arithmetic mean of the data given below is 28 , find (a) the mi...
Text Solution
|
- The size of land holdings of 380 families in a village is given below ...
Text Solution
|
- The following series relates to the daily income of workers employed i...
Text Solution
|
- The following table production yield in kg per hectare of wheat of 150...
Text Solution
|