Home
Class 11
ECONOMICS
Batsmen X and Y score following runs in ...

Batsmen X and Y score following runs in different innings they played in a test series. Which of the two is a better scorer? Who is more consistent?

Text Solution

Verified by Experts

In order to determine which of the two is a better scorer, we should compare average runs scored by two bastmen in different innings. And, in order to determine consistency of batting we should compare CV of the runs scored by the batsmen in different series.

Batsmen X: `barX=(sumX)/(N)=(500)/(10)=50`
`sigma_(X)=sqrt((sumx^(2))/(N))=sqrt((17,498)/(10))=sqrt(1,749.8)=41.83`
and `" " CV_(X)=(sigma)/(barX)xx100=(41.83)/(50)xx100=83.66`
Batsmen Y: `barY=(sumY)/(N)=(330)/(10)=33`
`sigma_(Y)=sqrt((sumY^(2))/(N))=sqrt((5,462)/(10))=sqrt(546.2)=23.37`
and `" " CV_(Y)=(sigma)/(barX)xx100`
`=(23.37)/(33)xx100=70.82`
Since average score of X is more than that of Y, we conclude that X is a better batsmen. But batting of X shows greater CV than Y. Hence, Y is relatively more consistent in batting than X.
Promotional Banner

Topper's Solved these Questions

  • MEASURES OF DISPERSION

    TARUN JAIN & VK OHRI|Exercise Miscellaneous Illustrations|24 Videos
  • MEASURES OF DISPERSION

    TARUN JAIN & VK OHRI|Exercise EXERCISE|12 Videos
  • MEASURES OF CENTRAL TENDENCY MEDIAN AND MODE

    TARUN JAIN & VK OHRI|Exercise NCERT Questions (With Hints to Answers)|5 Videos
  • ORGANISATION OF DATA

    TARUN JAIN & VK OHRI|Exercise EXERCISE NCERT|13 Videos

Similar Questions

Explore conceptually related problems

Two solutions X and Y are tested with universal indicator. Solution X turns orange whereas solution Y turns red. Which of the solutions is a stronger acid?

Following data show the number of runs made by Sachin and Sourabh in different Innings. Find out who is a good scorer and who is a consister player?

The average runs scored by a cricketer in 42 innings, is 30. The difference between his maximum and minimum scores in an innings is 100. if these two innings are not taken into consideration , then the average score of remaining 40 innings is 28. calculate the maximum runs scored by hin in an innings ?

In a game of chance a player throws a pair of dice and scores points equal to the difference between the numbers on the two dice. Winner is the person who scores exactly 5 points more than his opponent. If two players are playing this game only one time, then the probability that neither of them wins to

(A graph on “performance”) The given graph (Fig 15.7) represents the total runs scored by two batsmen A and B, during each of the ten different matches in the year 2007. Study the graph and answer the following questions. (i) What information is given on the two axes? (ii) Which line shows the runs scored by batsman A? (iii) Were the run scored by them same in any match in 2007? If so, in which match? (iv) Among the two batsmen, who is steadier? How do you judge it?

The table given below shows the runs scored by 4 different batsmen B1, B2, B3 and B4 in 5 different matches of a series. What is the difference in the total numberof runs scored by B1 and B4 in these 5 matches?

TARUN JAIN & VK OHRI-MEASURES OF DISPERSION-Learning by doing
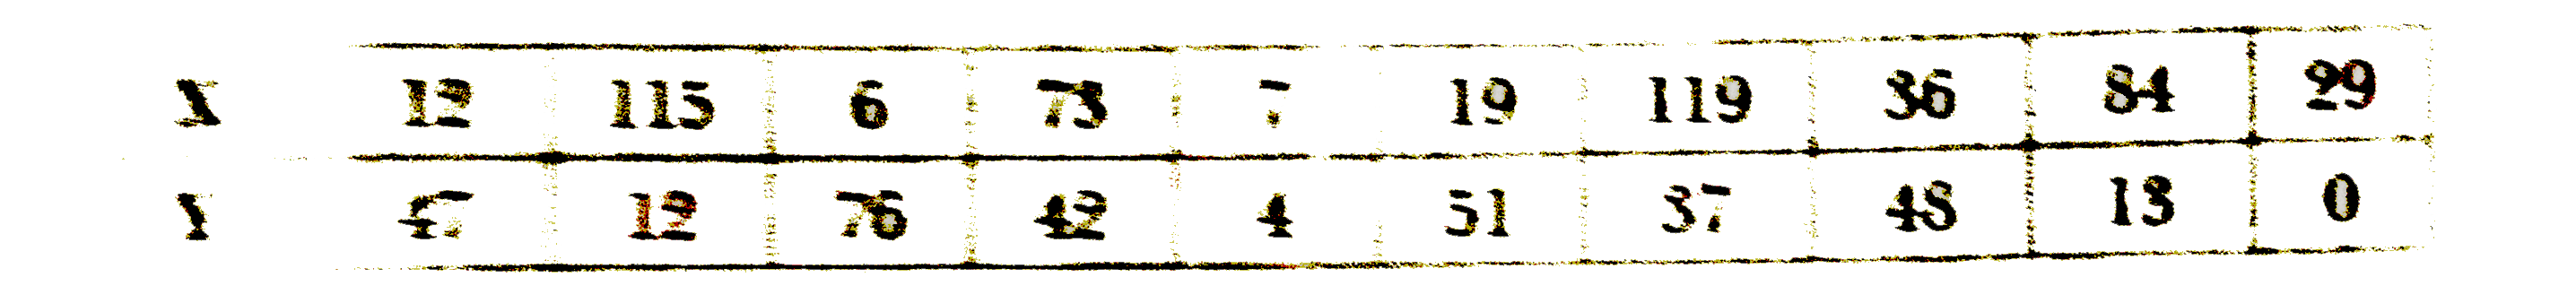
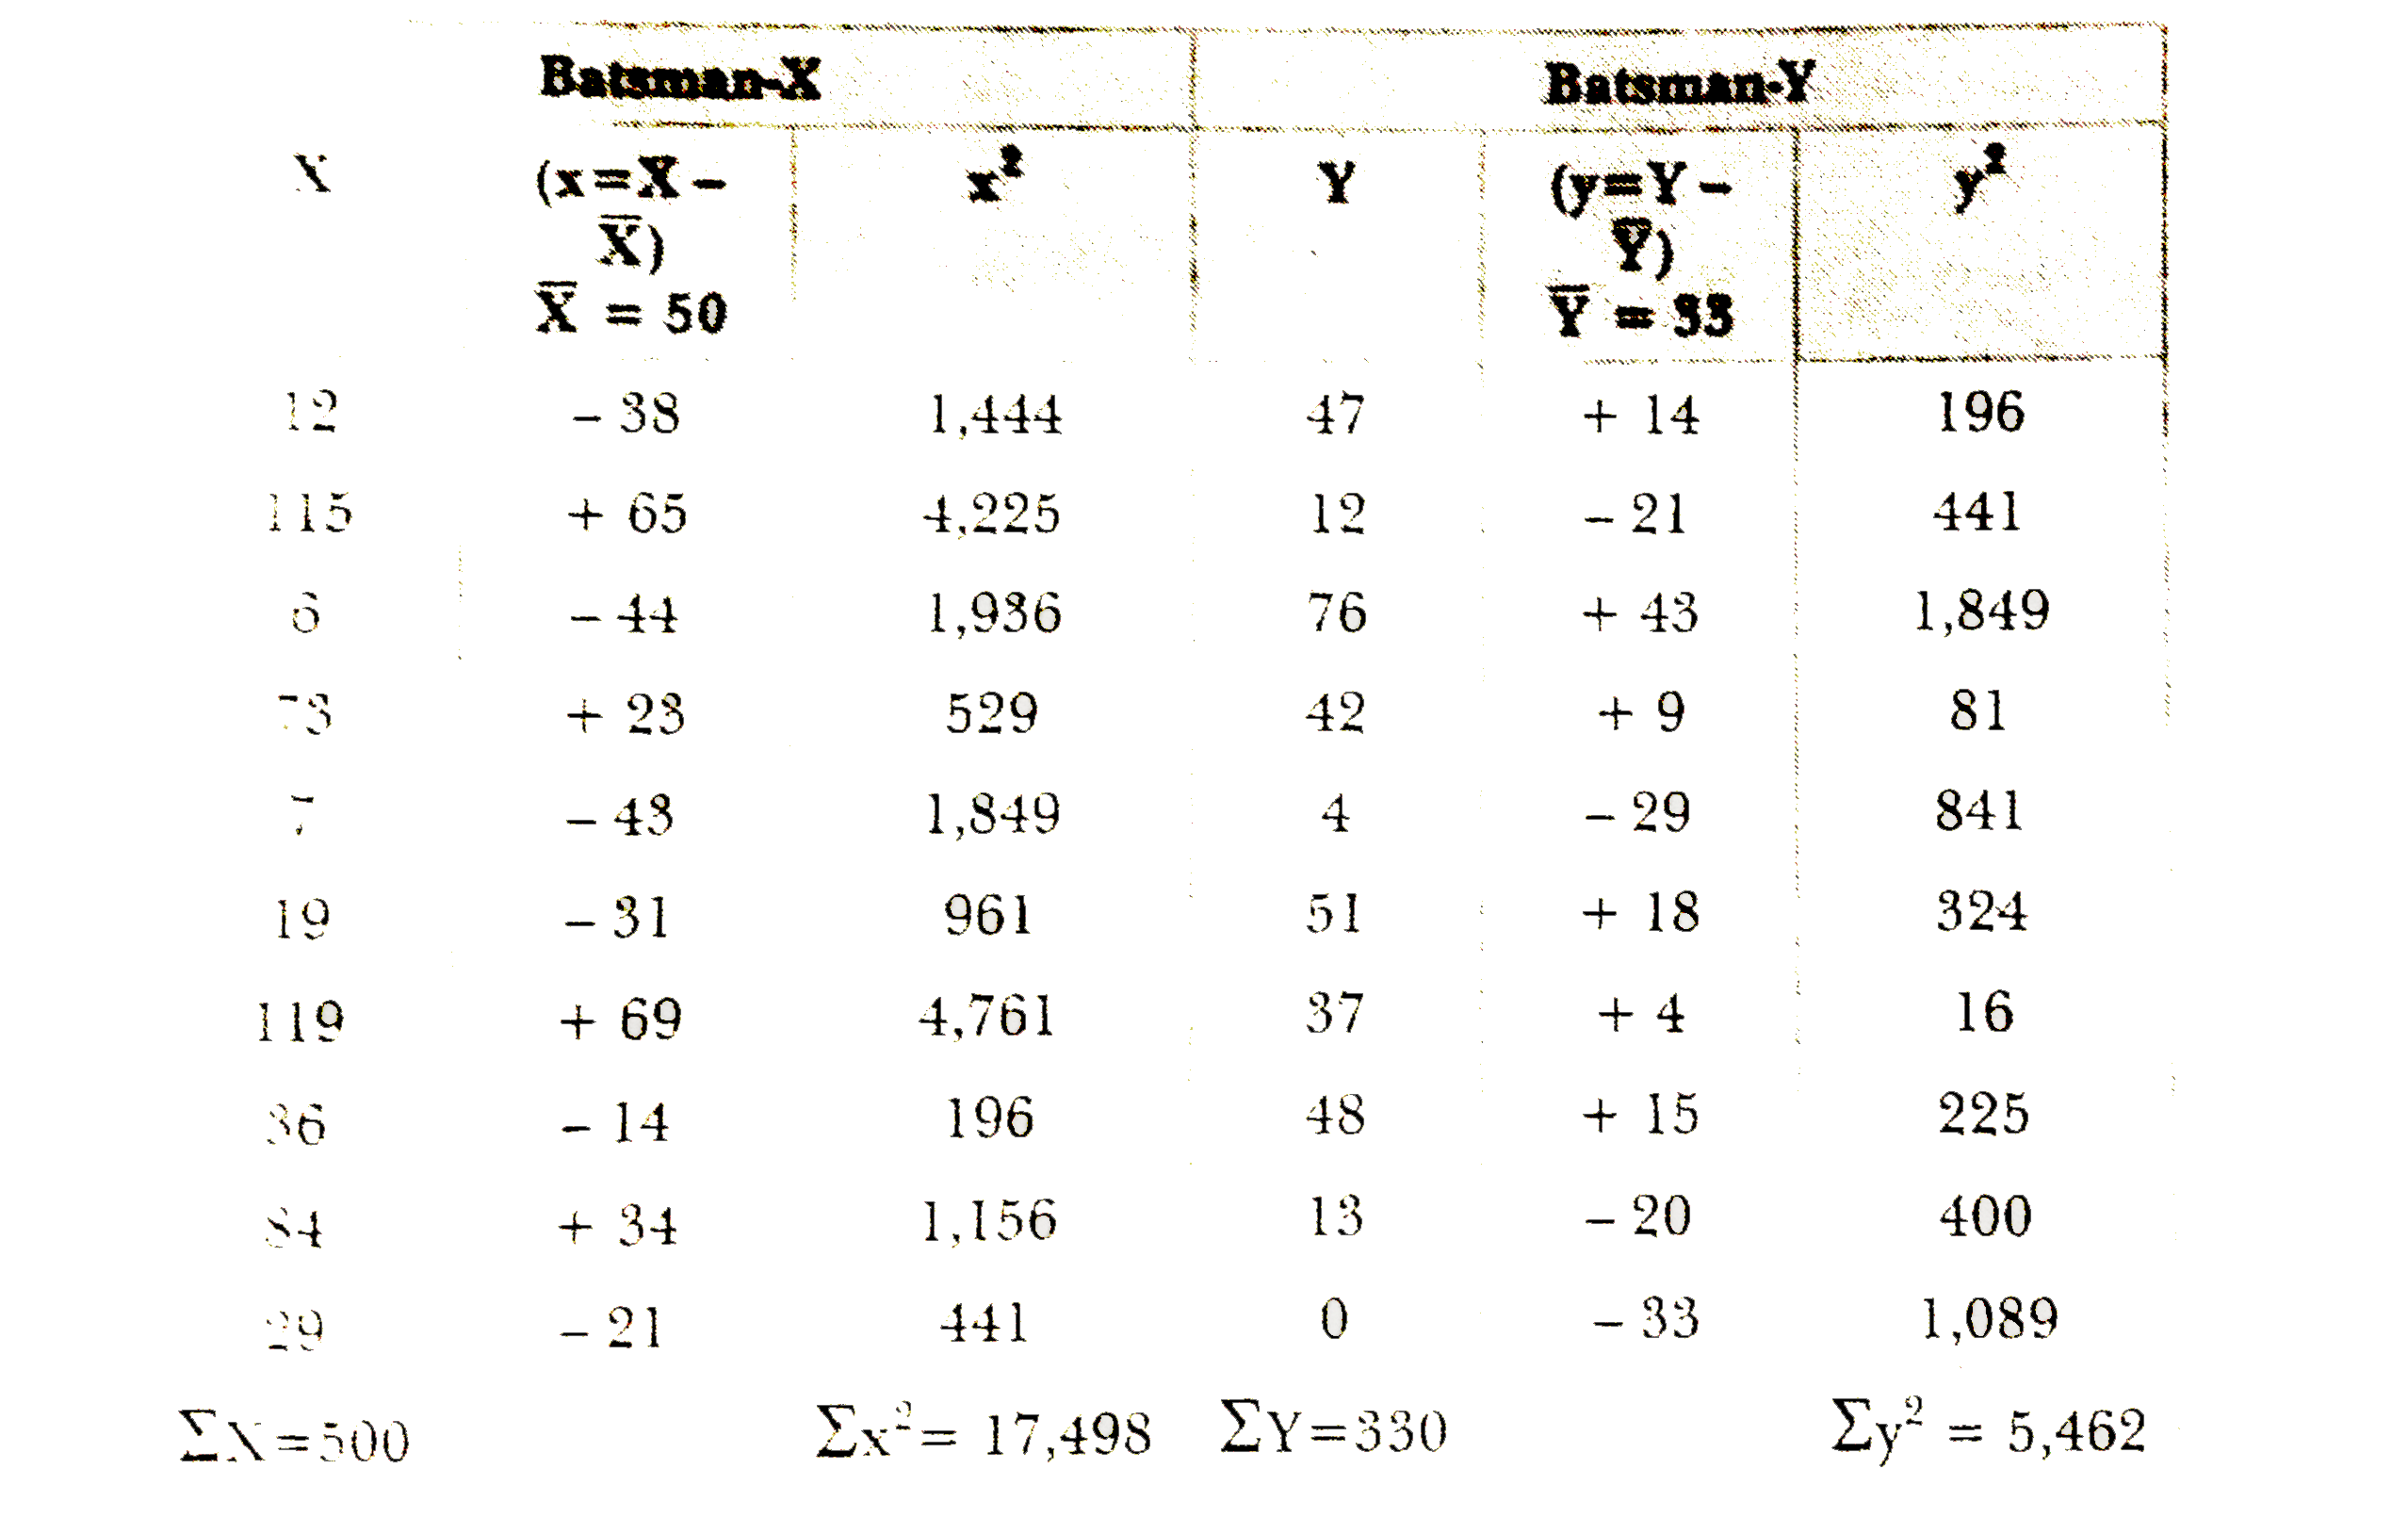
  1. Batsmen X and Y score following runs in different innings they played ...

    Text Solution

    |

  2. 5 students obtained following marks in Statistics: 20,35,25,30,15 ...

    Text Solution

    |

  3. Prices of shares of a company were noted as under from Monday through ...

    Text Solution

    |

  4. Calculate range and coefficient of range of the following series:

    Text Solution

    |

  5. Find out the range the coefficient of range from the following data:

    Text Solution

    |

  6. Marks obtained by 100 students of a class are given below. Find out ra...

    Text Solution

    |

  7. In an examination, 25 students obtained the following marks. Find out ...

    Text Solution

    |

  8. Estimate quartile deviation and the coefficient of quartile deviation ...

    Text Solution

    |

  9. Find out quartile deviation and coefficient of quartile deviation of t...

    Text Solution

    |

  10. Find out quartile deviation and the coefficient of quartile deviation ...

    Text Solution

    |

  11. Estimate quartile deviation and the coefficient of quartile deviation ...

    Text Solution

    |

  12. Given the following data, find out quartile deviation and the coeffici...

    Text Solution

    |

  13. Find out quartile deviation and coefficient of quartile deviation from...

    Text Solution

    |

  14. Find out mean deviation of the monthly income of the five families giv...

    Text Solution

    |

  15. Weight of nine students of a class is given below. Calculate mean devi...

    Text Solution

    |

  16. Find out mean deviation and its coefficient of the following data:

    Text Solution

    |

  17. Calculate mean deviation from the following data, using mean and media...

    Text Solution

    |

  18. The following table gives distribution of marks for 50 students of a c...

    Text Solution

    |

  19. Estimate the coefficient of mean deviation from the median from the fo...

    Text Solution

    |

  20. The following data gives marks obtained by 7 students of a class. Find...

    Text Solution

    |

  21. Weight of some students is given below in hilograms. Find out standard...

    Text Solution

    |