Text Solution
Verified by Experts


Topper's Solved these Questions
STATISTICS
NAGEEN PRAKASHAN|Exercise Problems From NCERT/exemplar|22 VideosSTATISTICS
NAGEEN PRAKASHAN|Exercise Exercise 14a|10 VideosQUADRILATERALS
NAGEEN PRAKASHAN|Exercise Revision Exercise (long Answer Questions)|5 VideosSURFACE AREA AND VOLUME
NAGEEN PRAKASHAN|Exercise Revision Exercise (long Answer Questions)|10 Videos
Similar Questions
Explore conceptually related problems
NAGEEN PRAKASHAN-STATISTICS-Revision Exercise
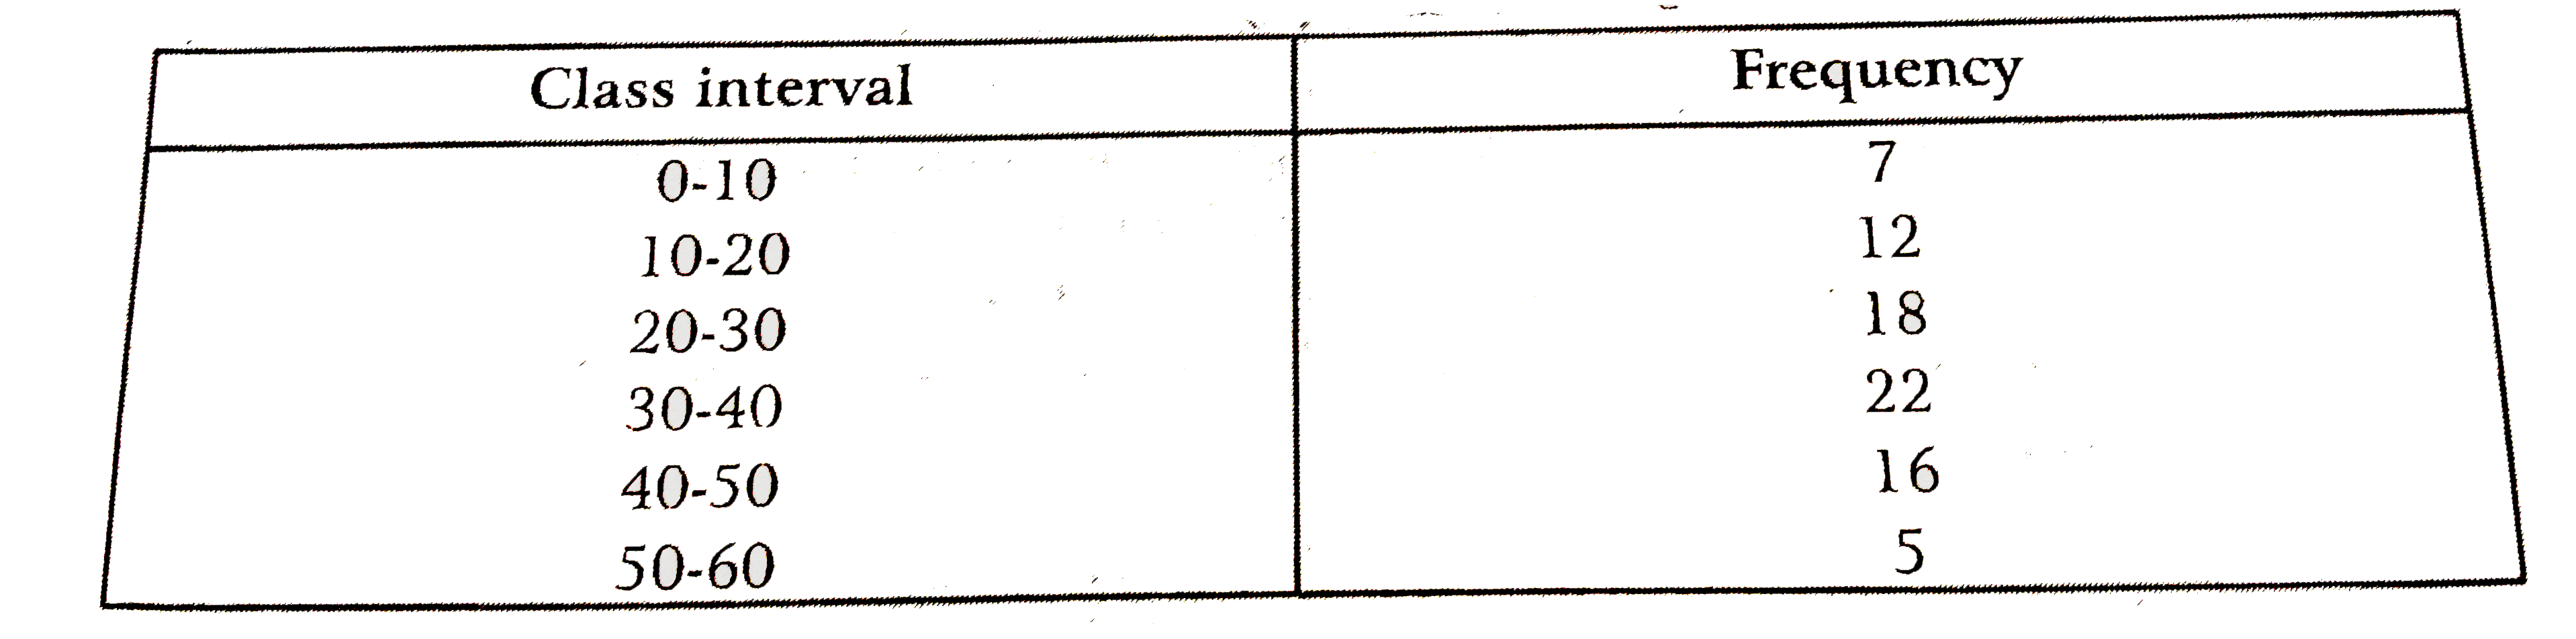
- The table given below shows a frequency distribution table, find (a)...
Text Solution
|
- If the heights of 5 persons are 140 cm, 150cm, 152 cm and 161 cm respe...
Text Solution
|
- Find the mean of x, x+2, x+4, x+6, x+8
Text Solution
|
- Find the mean of the following distribution:
Text Solution
|
- Find the value of P if the mean of the following distribution is 7.5
Text Solution
|
- The mean weight of 60 students of a class is 52.75 kg. If the mean wei...
Text Solution
|
- The runs scored by 11 numbers of a cricket team are 14, 30, 43, 42, 12...
Text Solution
|
- Find the median of the following distribution: 40, 49, 17, 68, 44, ...
Text Solution
|
- The median of the observations 11, 12, 14, 18, (x+4), 30, 32, 35, 41 a...
Text Solution
|
- Find the mode of the following distribution 7, 9, 8, 11, 8, 12, 8, 9.
Text Solution
|
- The marks of 20 students in a test were as follows: 5, 6, 8, 9, 10, 11...
Text Solution
|