


Similar Questions
Explore conceptually related problems
Recommended Questions
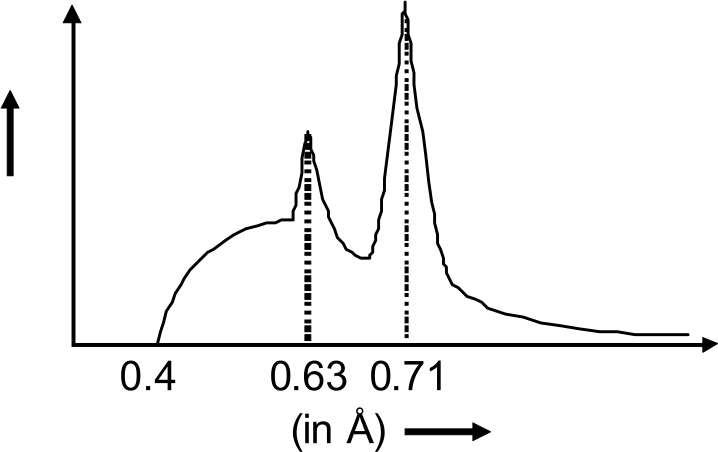
- Figure shows intensity versus wavelength graph of X-rays coming from c...
Text Solution
|
- The energy of a photon of characteristic X-ray from a Coolidge tube co...
Text Solution
|
- Cutoff wavelength of X-rays coming from a Coolidge tube depends on the
Text Solution
|
- The intensity of X- ray from a coolidge tube is plotted againest wavel...
Text Solution
|
- Figure shows intensity versus wavelength graph of X-rays coming from c...
Text Solution
|
- Figure shows intensity versus wavelength graph of X-rays coming from c...
Text Solution
|
- The intensity of X - rays from a Coolidge tube is plotted against wave...
Text Solution
|
- In the X-rays produced by a Coolidge tube let lambda(C) be the cut-off...
Text Solution
|
- The intensity of X-rays from a coolidge tube is plotted against wavele...
Text Solution
|