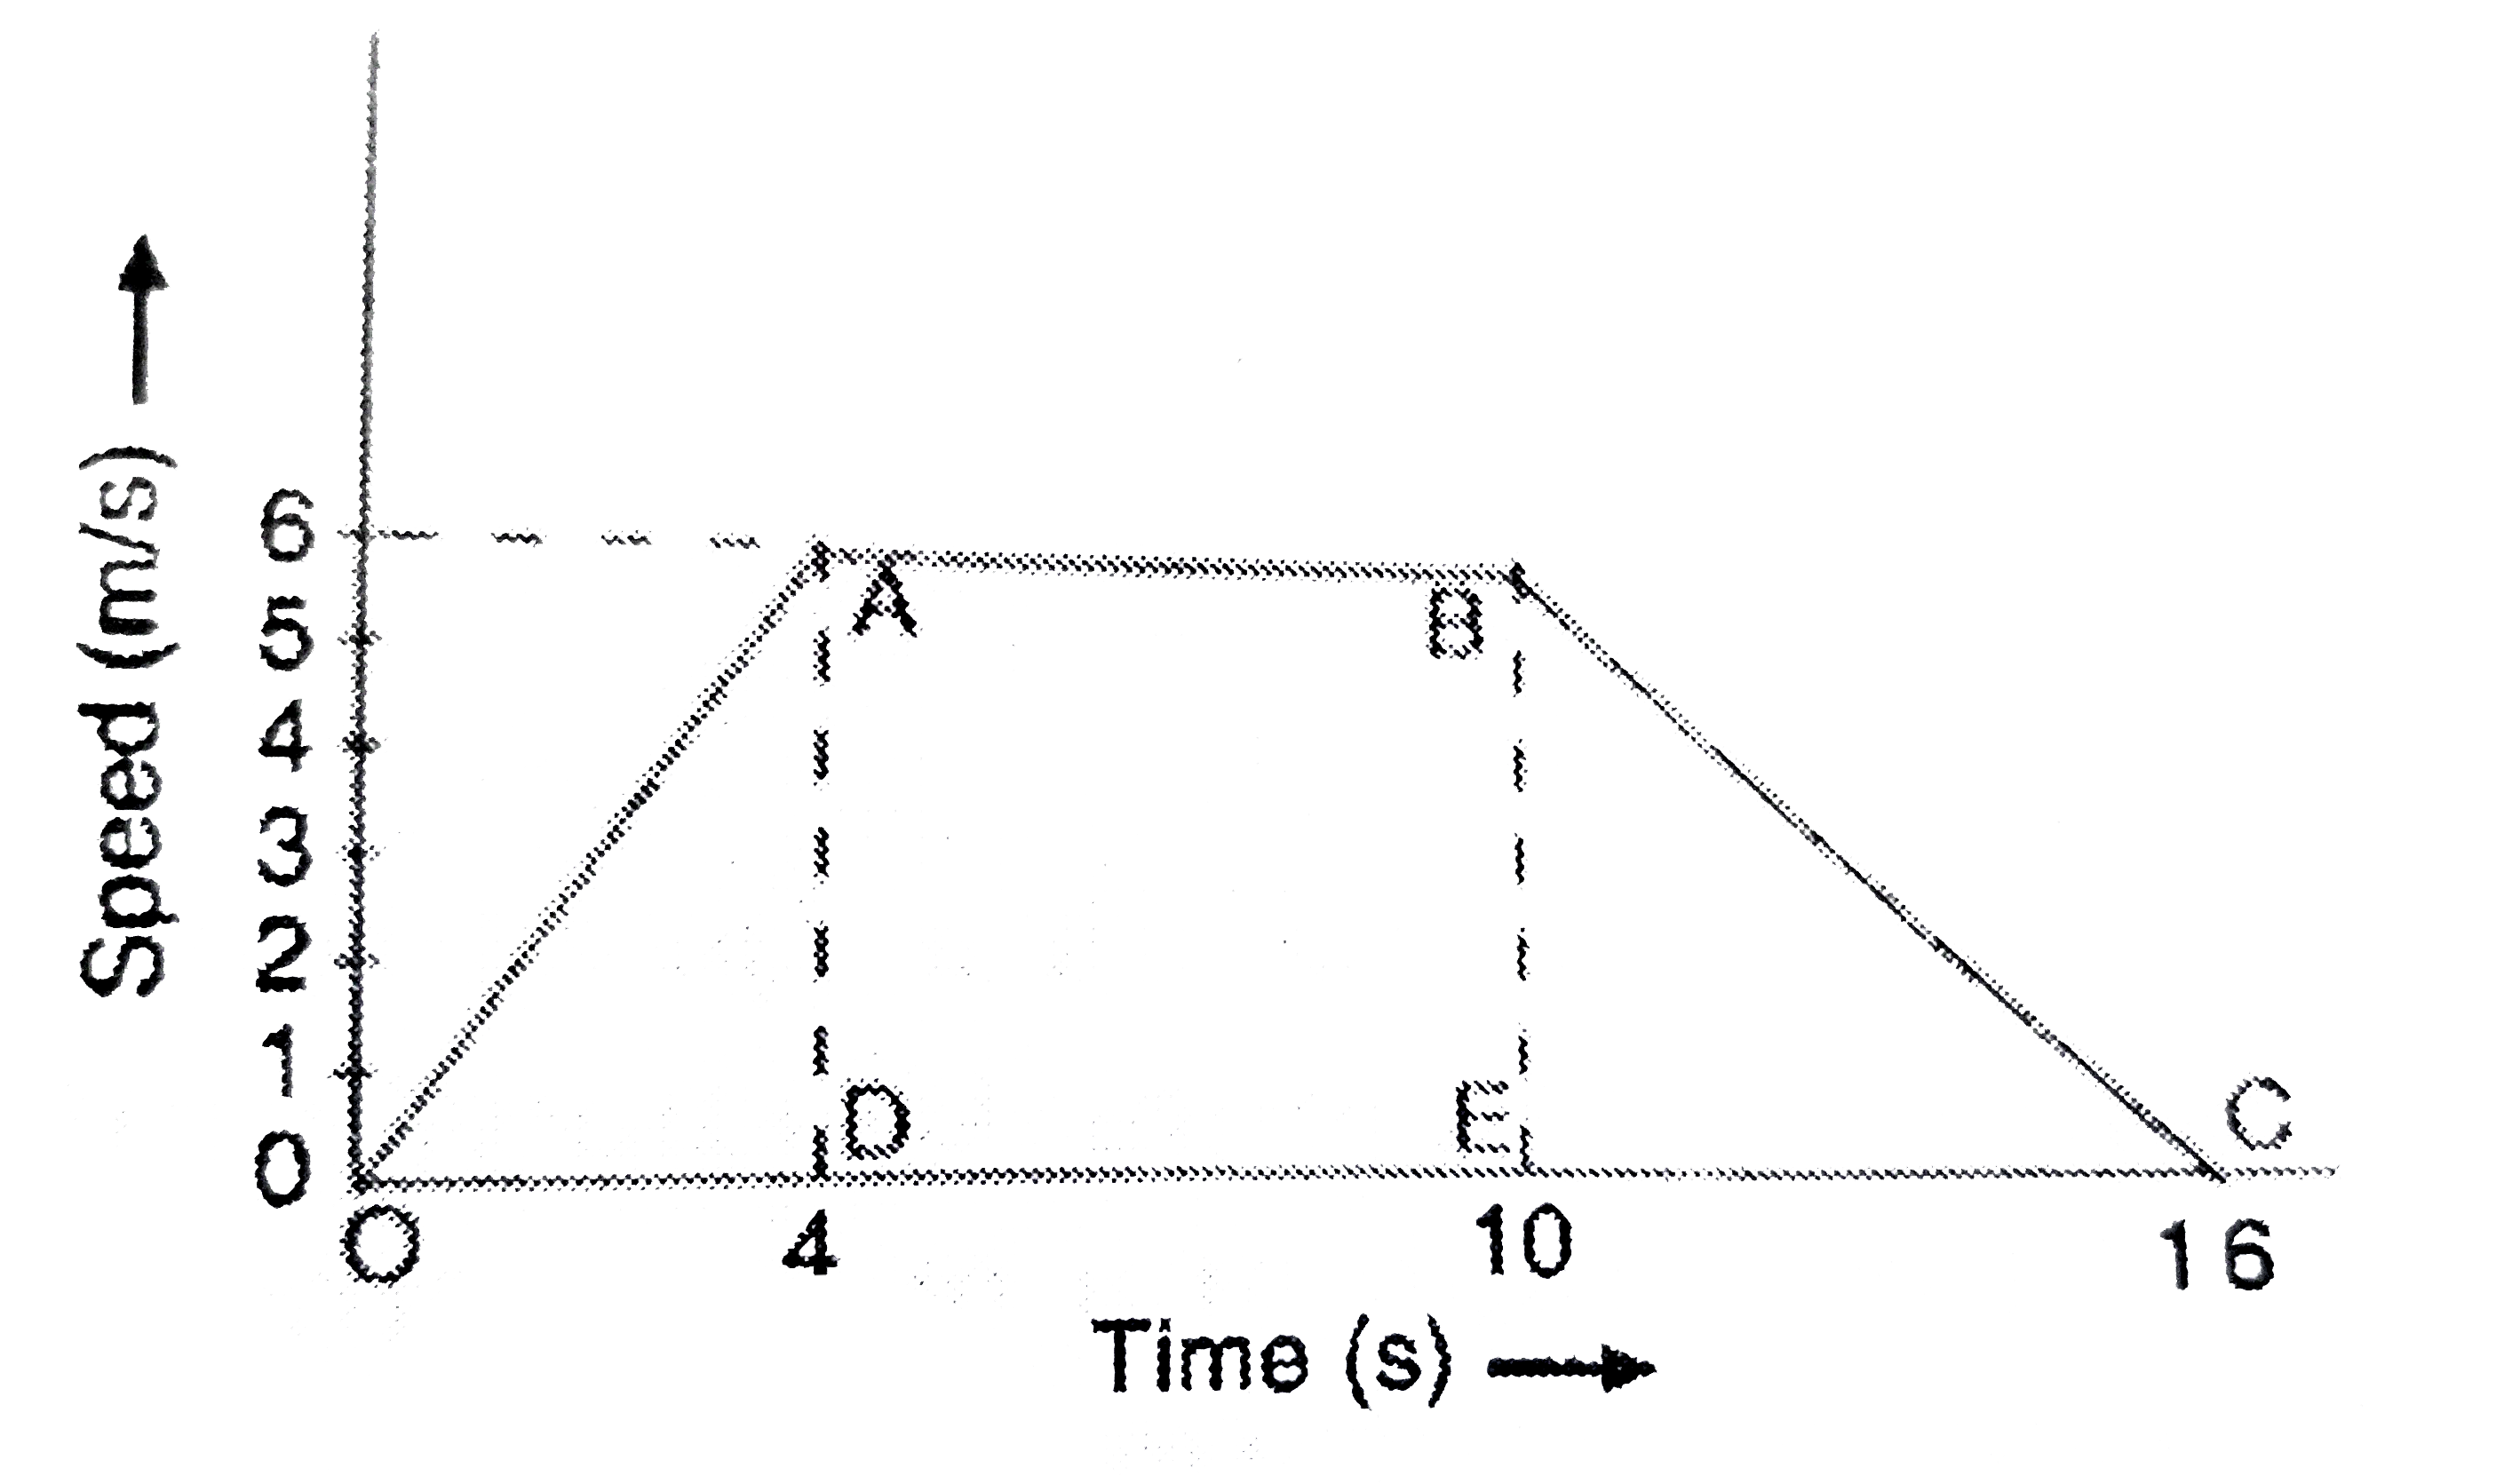
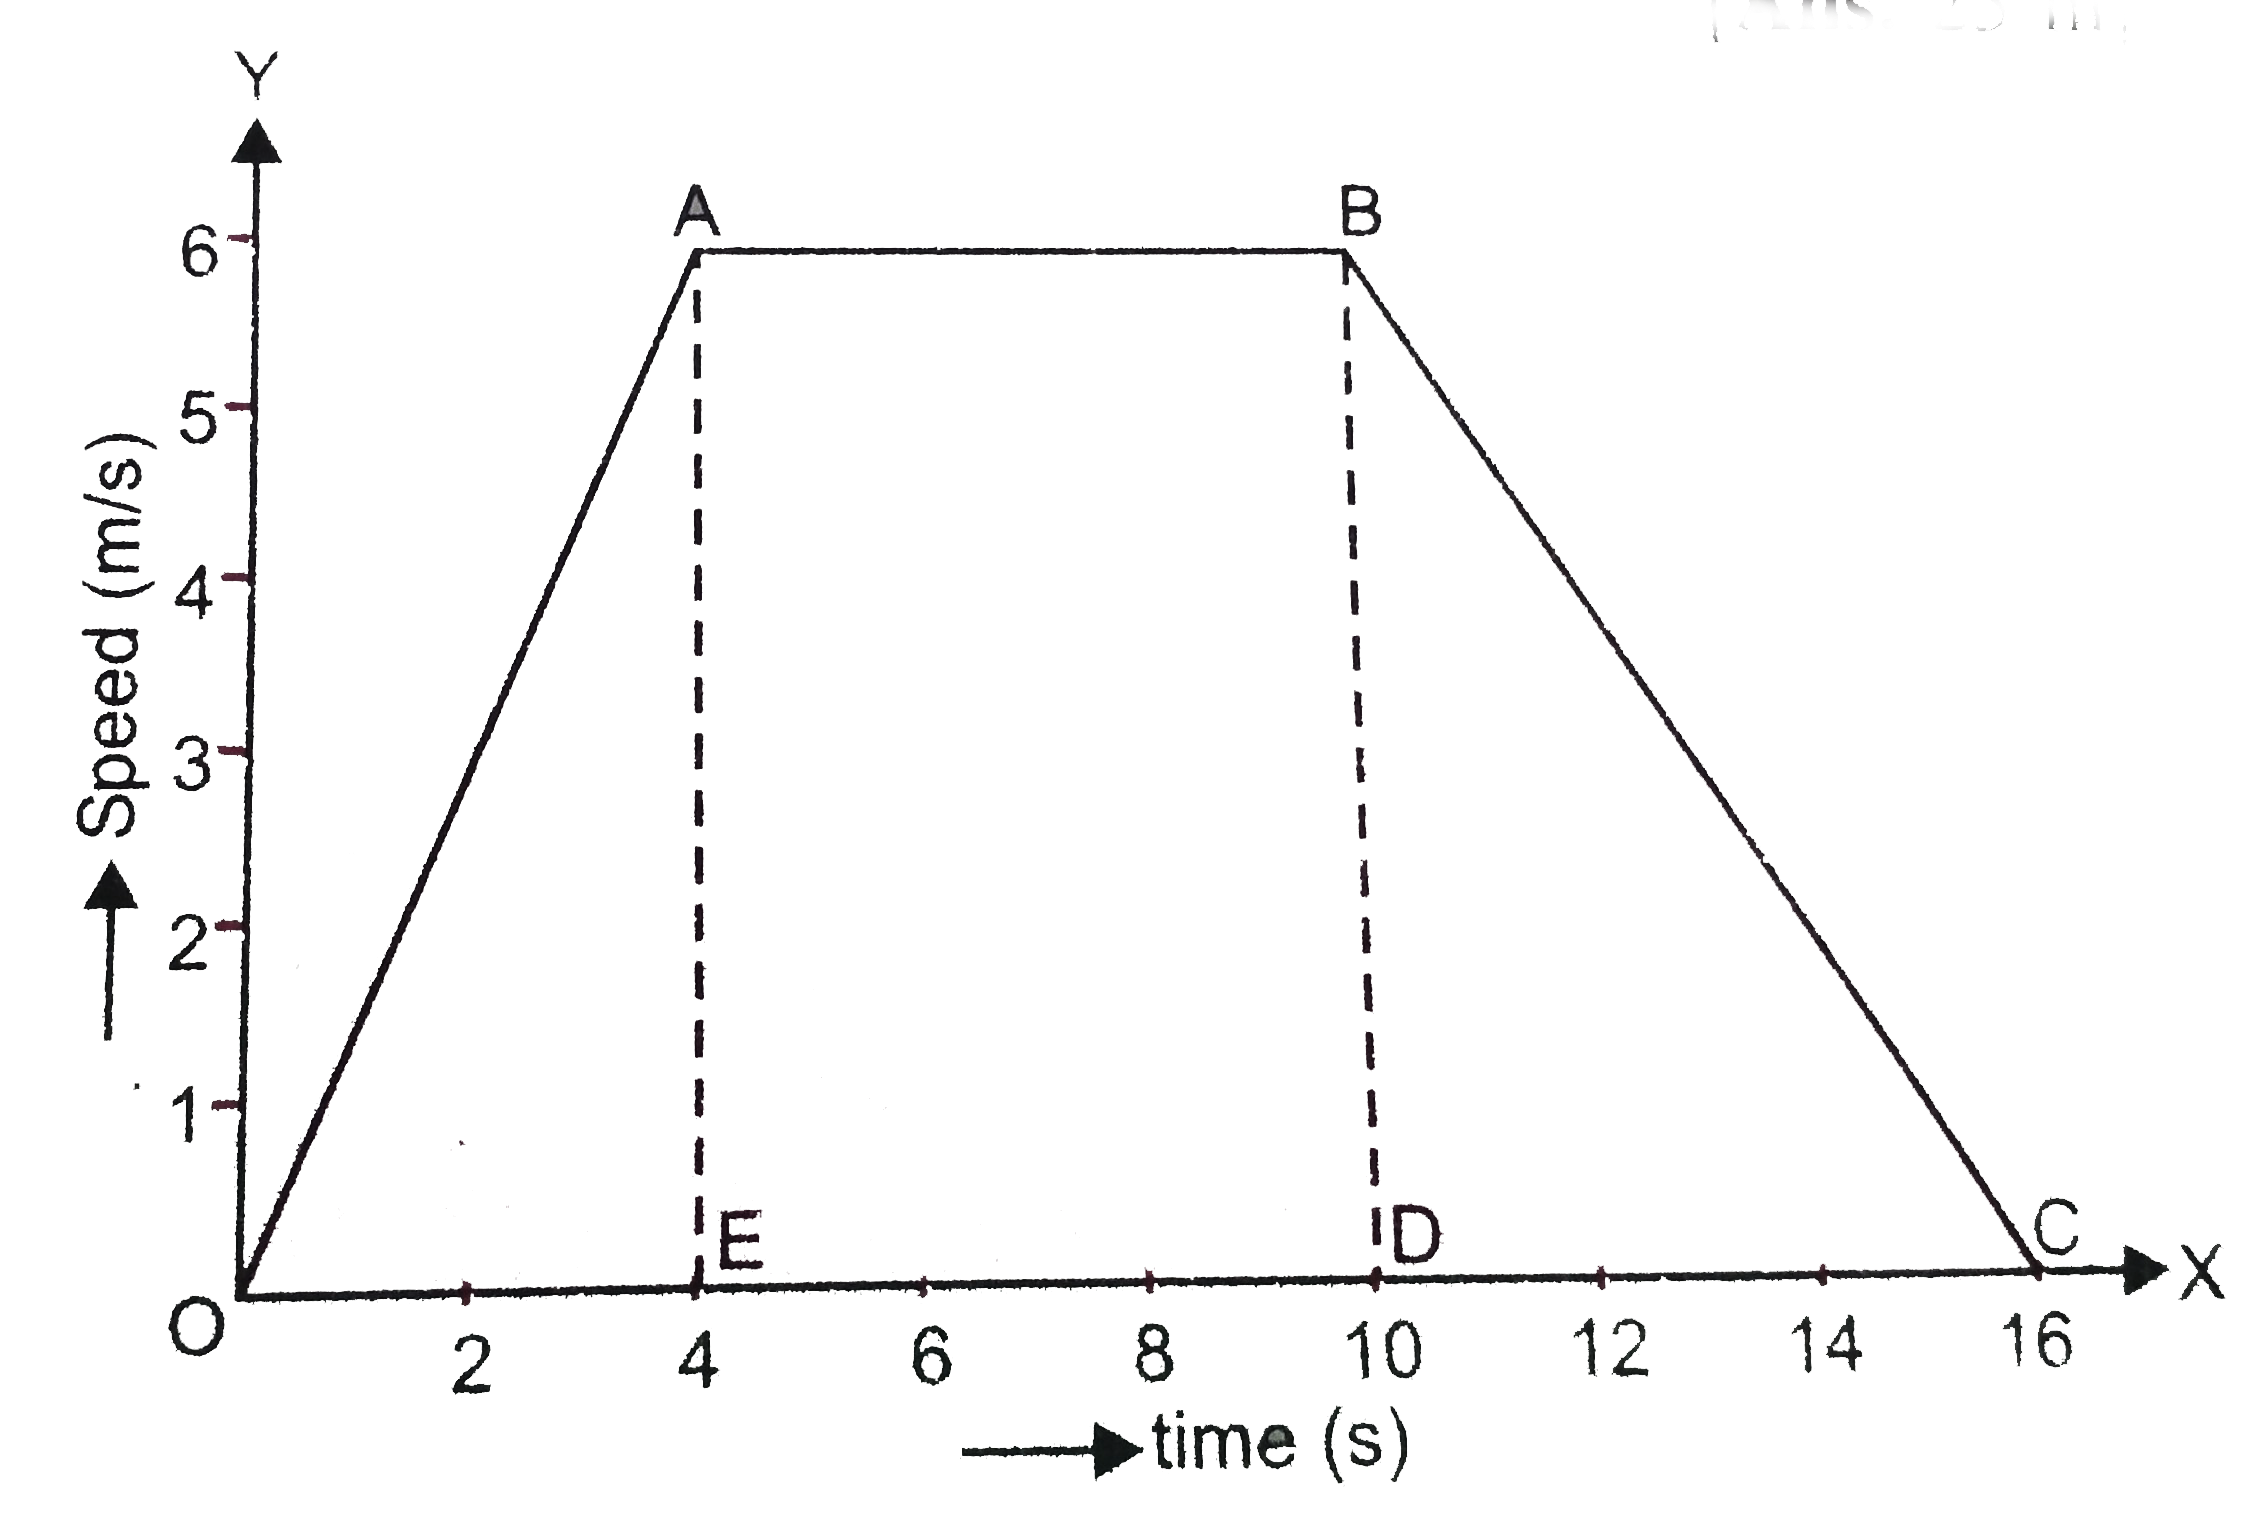
(a) Oa is a straight line graph between speed and time, and it is sloping upwards from O to A. Therefore, the graph line OA represents uniform acceleration.
(b) AB is a straight line graph between speed and time, which is parallel to the time axis (x-axis). So, AB represents uniform speed (or constant speed). There is no acceleration from A to B.
(c) BC is a straight line graph between speed and time which is sloping downwards from B to C. Therefore, BC represents uniform retardation (or negative acceleration).
(d) Let us find out the acceleration now. We have just seen that the graph line OA represents acceleration.
So, the slope of speed-time graph OA will give us the acceleration of the body. Thus,
`" "` Acceleration = Slope of line OA
`" "=(AD)/(OD)`
Now, in the given graph (Figure 40), we find that AD = 6 m/s and OD = 4 seconds. So, putting these values in the above relation, we get :
`" "` Acceleration = `(6 m//s)/(4s)`
= 1.5 m/`s^(2)``" "` ...(1)
(e) Let us calculate the retardation now. We have discussed above that the graph line BC represents retardation. So, the slope of speed-time graph BC will be equal to the retadation of the body. So,
`" "` Retardation = Slope of line BC
`" "=(BE)/(EC)`
Now, in the graph given to us (Figure 40), we find that BE = 6 m/s and EC = 16-10=6 seconds. So, putting these values in the above relation, we get :
`" "` Retardation = `(6 m//s)/(6 s)`
`" "` = 1 m/`s^(2)` `" "` ...(2)
(f) We will now find out the distance travelled by the body in moving from A to B (Figure 40). We have studied that in a speed-time graph, the distace travelled by the body is equal to the area enclosed between the speed-time graph and the time-axis. Thus,
Distance travelled from A to B = Area under the line AB and the time axis
`" "` = Area of rectangle DABE
`" "= DAxxDE`
Now, from the given graph (Figure 40), we find that DA = 6 m/s and DE = 10 -4 = 6 s. Therefore,
Distance travelled from A to B = `6xx6`
= 36 m