Home
Class 9
PHYSICS
Draw a veocity-time graph to show the f...

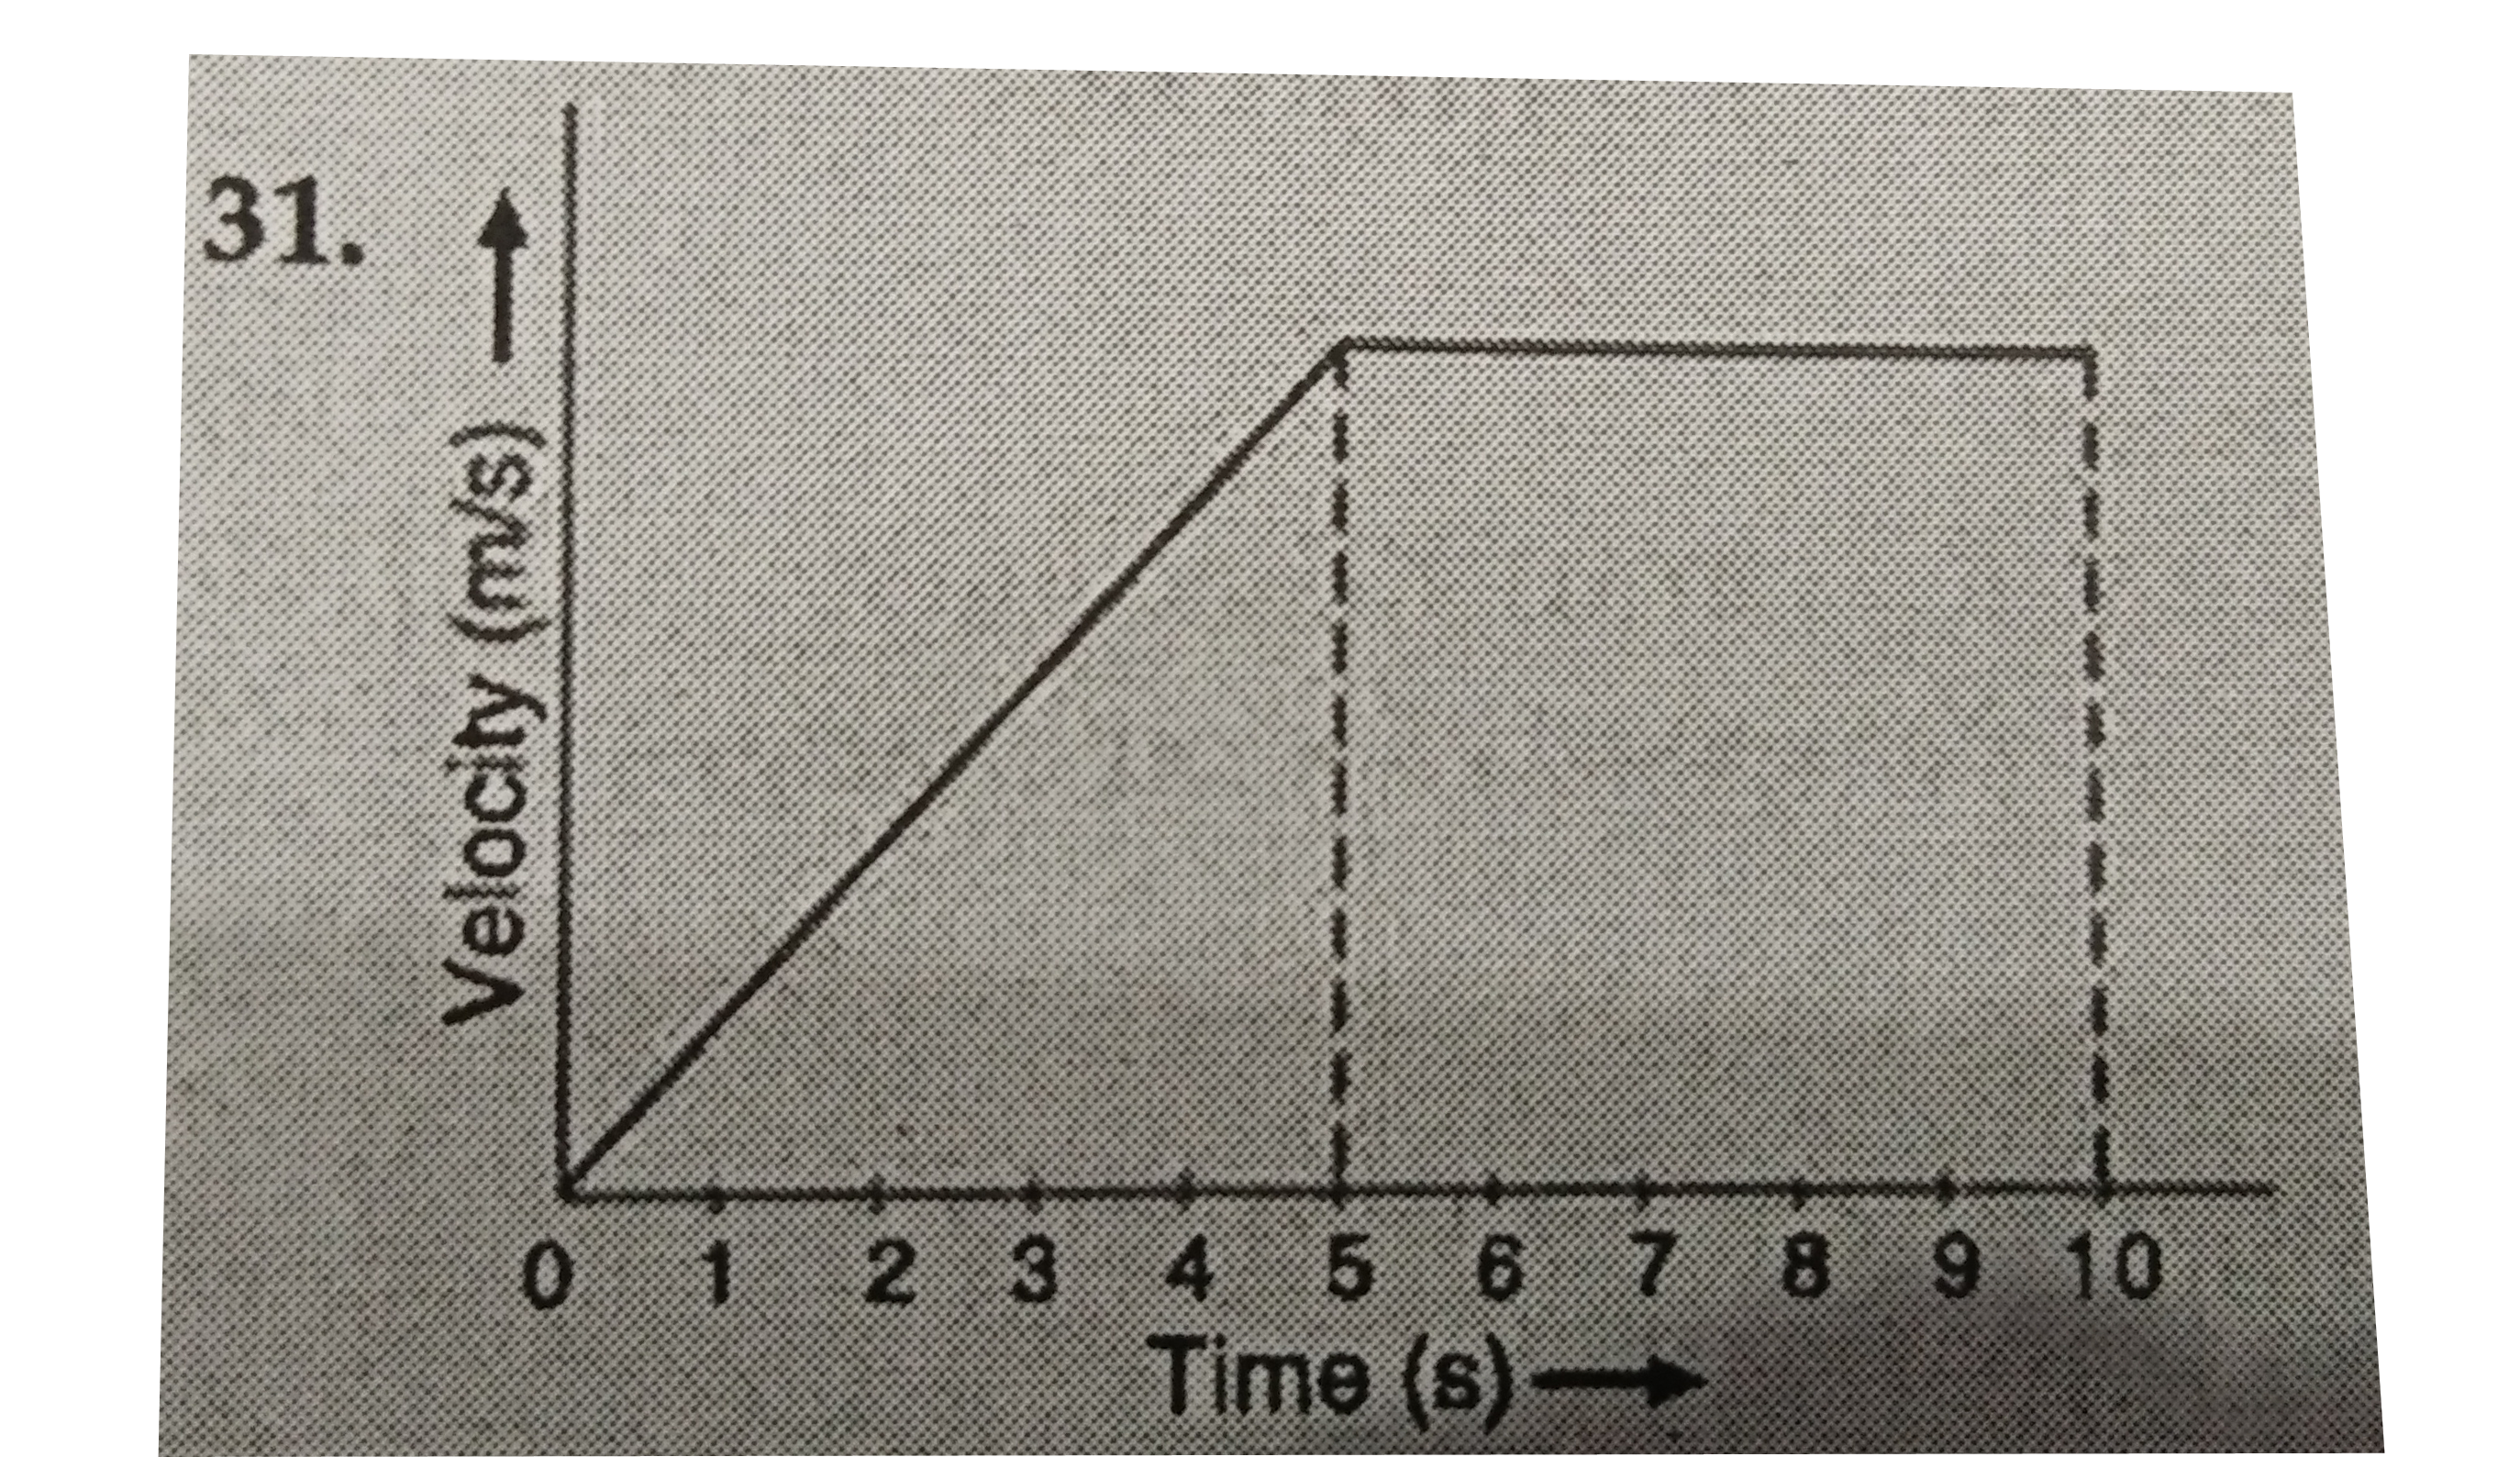
Draw a veocity-time graph to show the following motion :
A car accelerates uniformly from rest for 5 s , then it travels at a steady velocity for 5 s.

Text Solution

Verified by Experts

Promotional Banner

Topper's Solved these Questions

  • MOTION

    LAKHMIR SINGH & MANJIT KAUR|Exercise SAMPLE PROBLEM|1 Videos
  • MOTION

    LAKHMIR SINGH & MANJIT KAUR|Exercise VERY SHORT ANSWER TYPE QUESTIONS|3 Videos
  • MODEL TEST PAPER 5

    LAKHMIR SINGH & MANJIT KAUR|Exercise Section B|2 Videos
  • SOUND

    LAKHMIR SINGH & MANJIT KAUR|Exercise Value Based Questions|20 Videos

Similar Questions

Explore conceptually related problems

A car accelerates uniformly at 4 m s^(-2) from rest. Find its velocity at the end of 5 seconds.

The velocity time graph of the motion of a car is given here.

A car accelerates uniformly from 18 kmh^(- 1) to 72 (kmh^- 1) in 5 s. The acceleration of the car is:

Draw velocity-time graph of a uniformly accelerated in one dimension and explain that the distance travelled is equal to the area under velocity-time graph.

A car accelerates uniformly from 18kmh^(-1) " to " 72 kmh^(-1) in 10s. Calculate the acceleration of the car.

Represent the velocity-time graph for a uniformly accelerated motion when acceleration is positive.

Draw the velocity-time graph for uniformly accelerated motion. Show that slope of the velocity-time graph gives acceleration of the object.

First, an auto starts from rest and accelerates uniformly for 15 s acquiring a velocity of 30m//s. Secondly, the auto then moves:at this constant velocity of 30 m//s for the next 15 s, after which thirdly, the auto decelerates uniformly by braking at 1.5 m// s^(2) until it stops. (a) Sketch the velocity-time graph. (b) Sketch the acceleration-time graph for auto (c) Sketch displacement-time graph for auto

For a particle moving in a straight line, the velocity-time graph is as shown in the figure. Find the acceleration at time t=1 s 2.5 s and 5 s . Sketch the acceleration time graph.