Text Solution
Verified by Experts


Similar Questions
Explore conceptually related problems
Recommended Questions
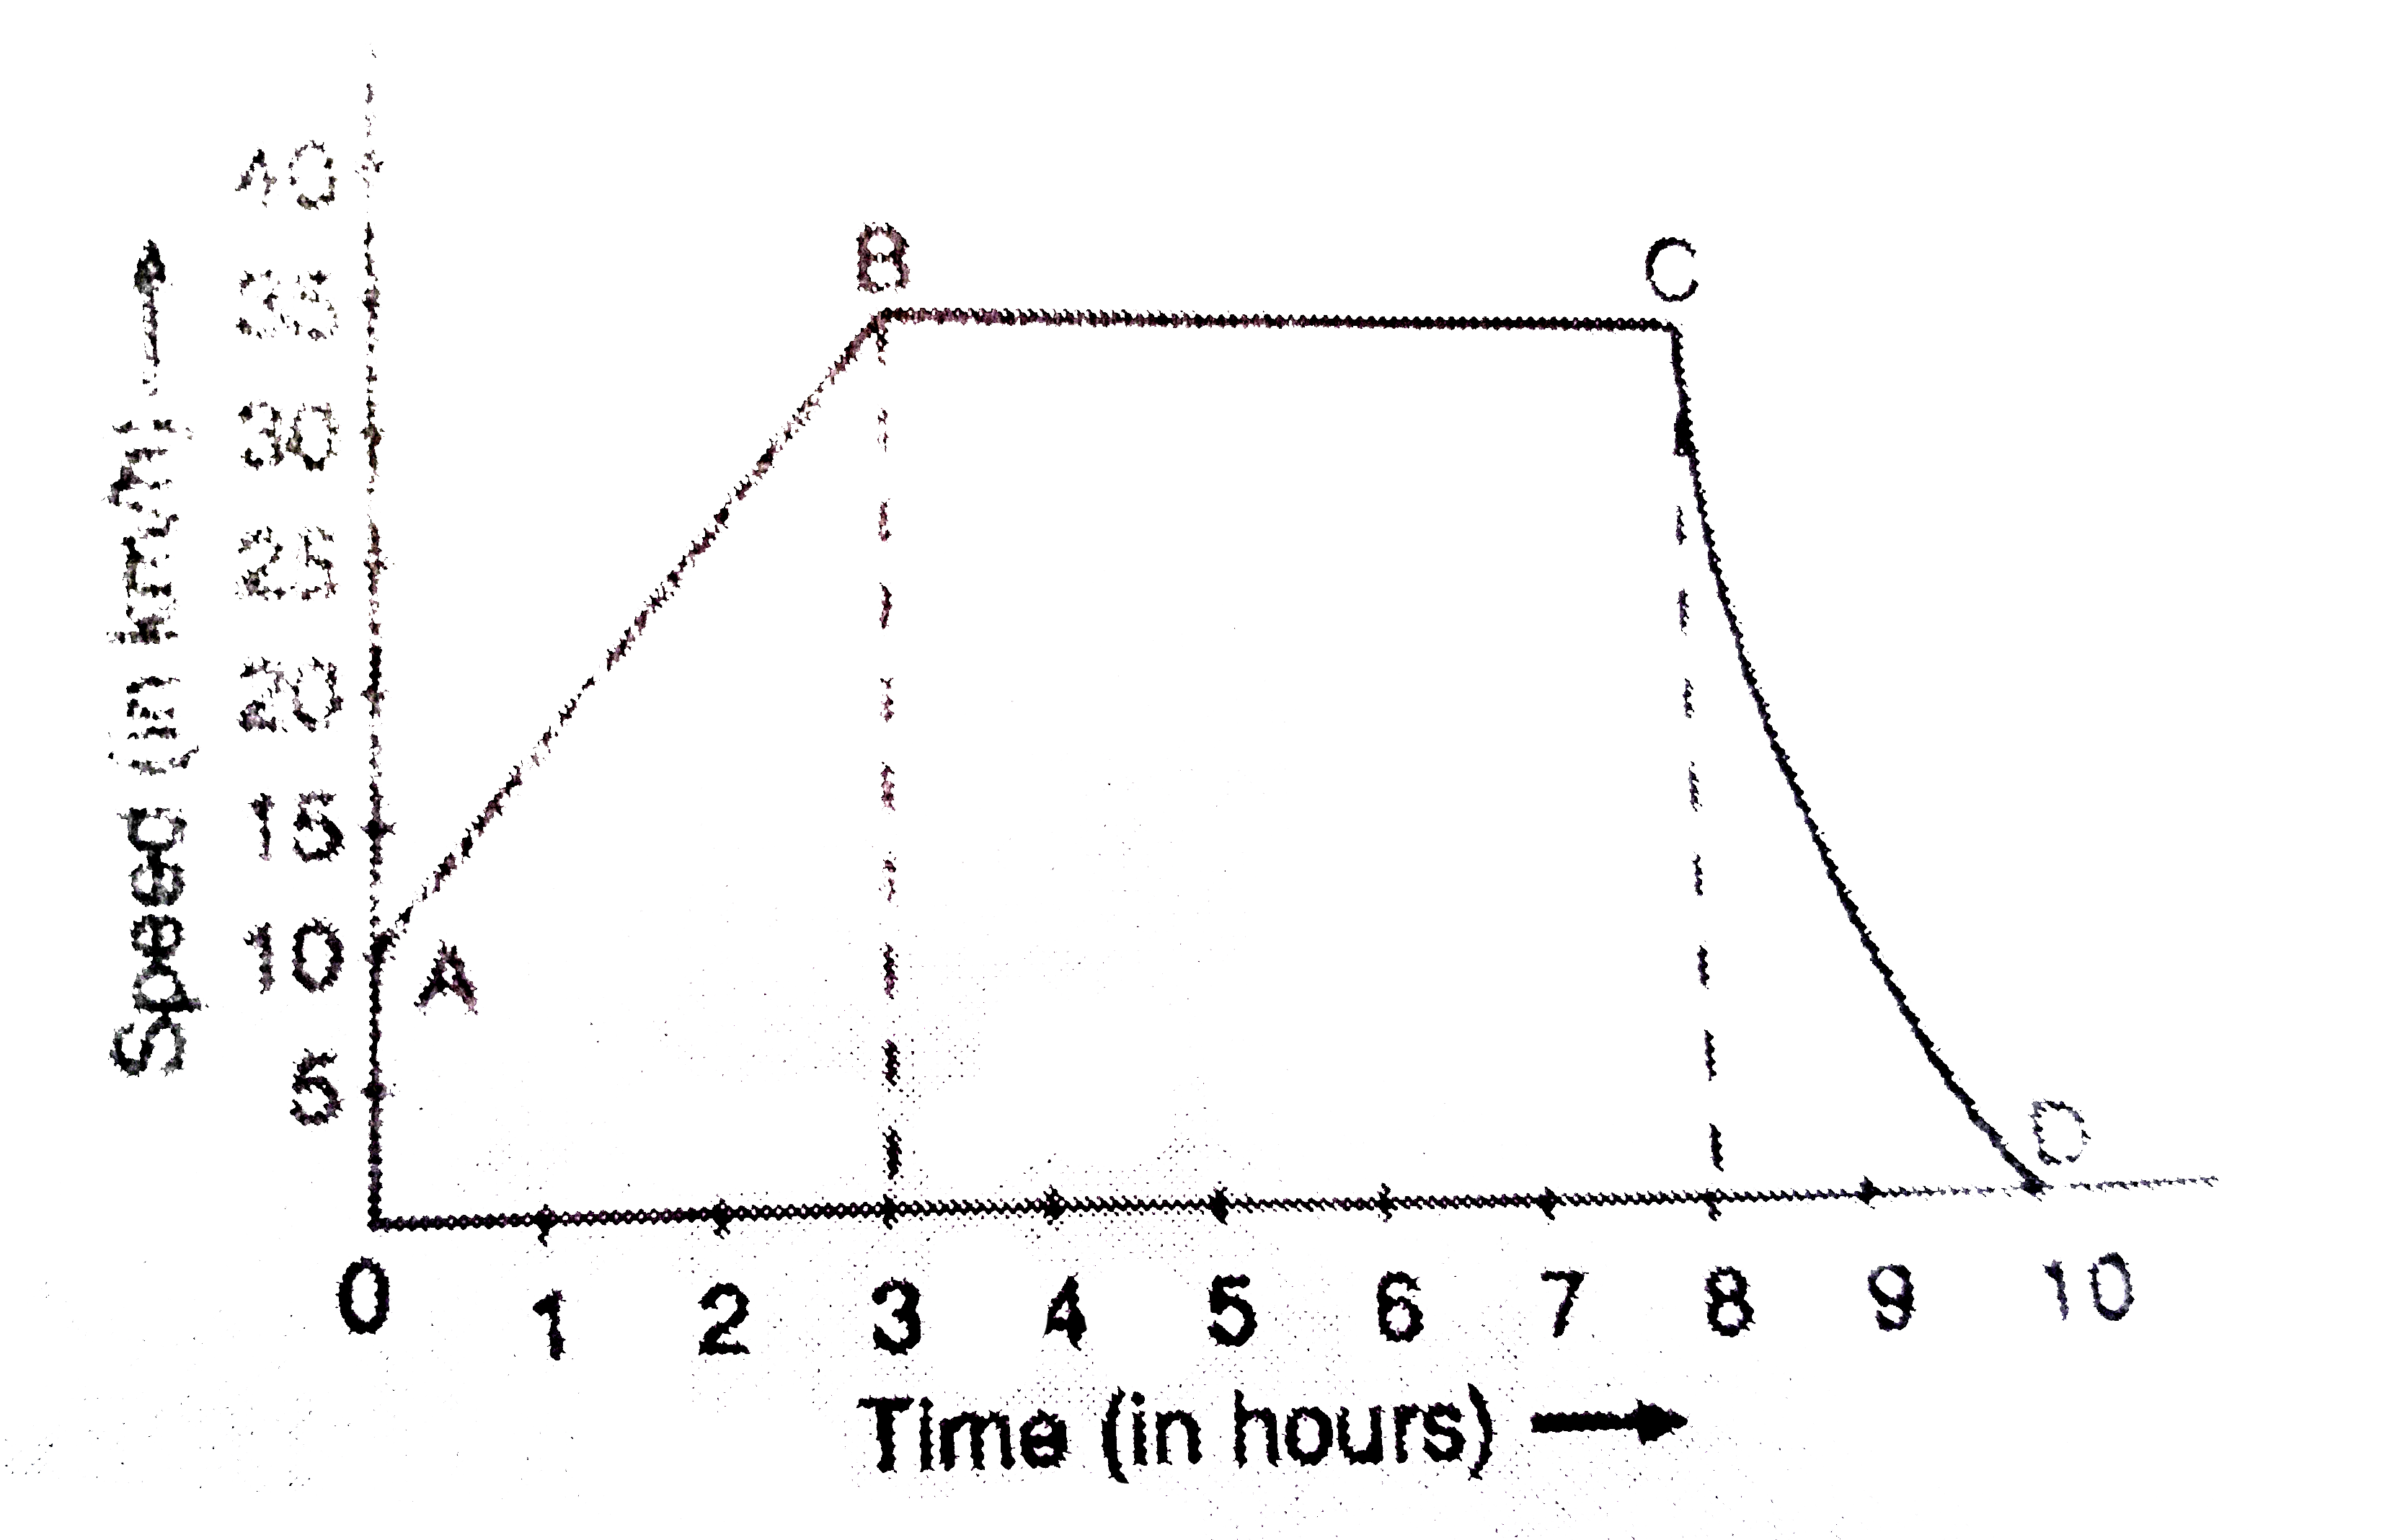
- The graph given alongside shows how the speed of a car changes with ti...
Text Solution
|
- The graph given alongside shows how the speed of a car changes with ti...
Text Solution
|
- किसी कार का चाल-समय चित्र में दर्शाया गया है । (a) पहले 4 s में कार ...
Text Solution
|
- निम्नलिखित स्थितियों में गति के दूरी –समय ग्राफ की आकृति दर्शाइए- क. ...
Text Solution
|
- चित्र 3.40 में सीधी रेखा में गतिशील कार स्थिति - समय ग्राफ प्रदर्शित ह...
Text Solution
|
- चित्र 3.40 में सीधी रेखा में गतिशील कार स्थिति - समय ग्राफ प्रदर्शित ह...
Text Solution
|
- The speed-time graph for a car is shown is Fig. Which part of the...
Text Solution
|
- Speed - time graph for a car is show in the fig 1.13:Which part of the...
Text Solution
|
- The speed-time graph of a car is shown in figure given below Speed-tim...
Text Solution
|