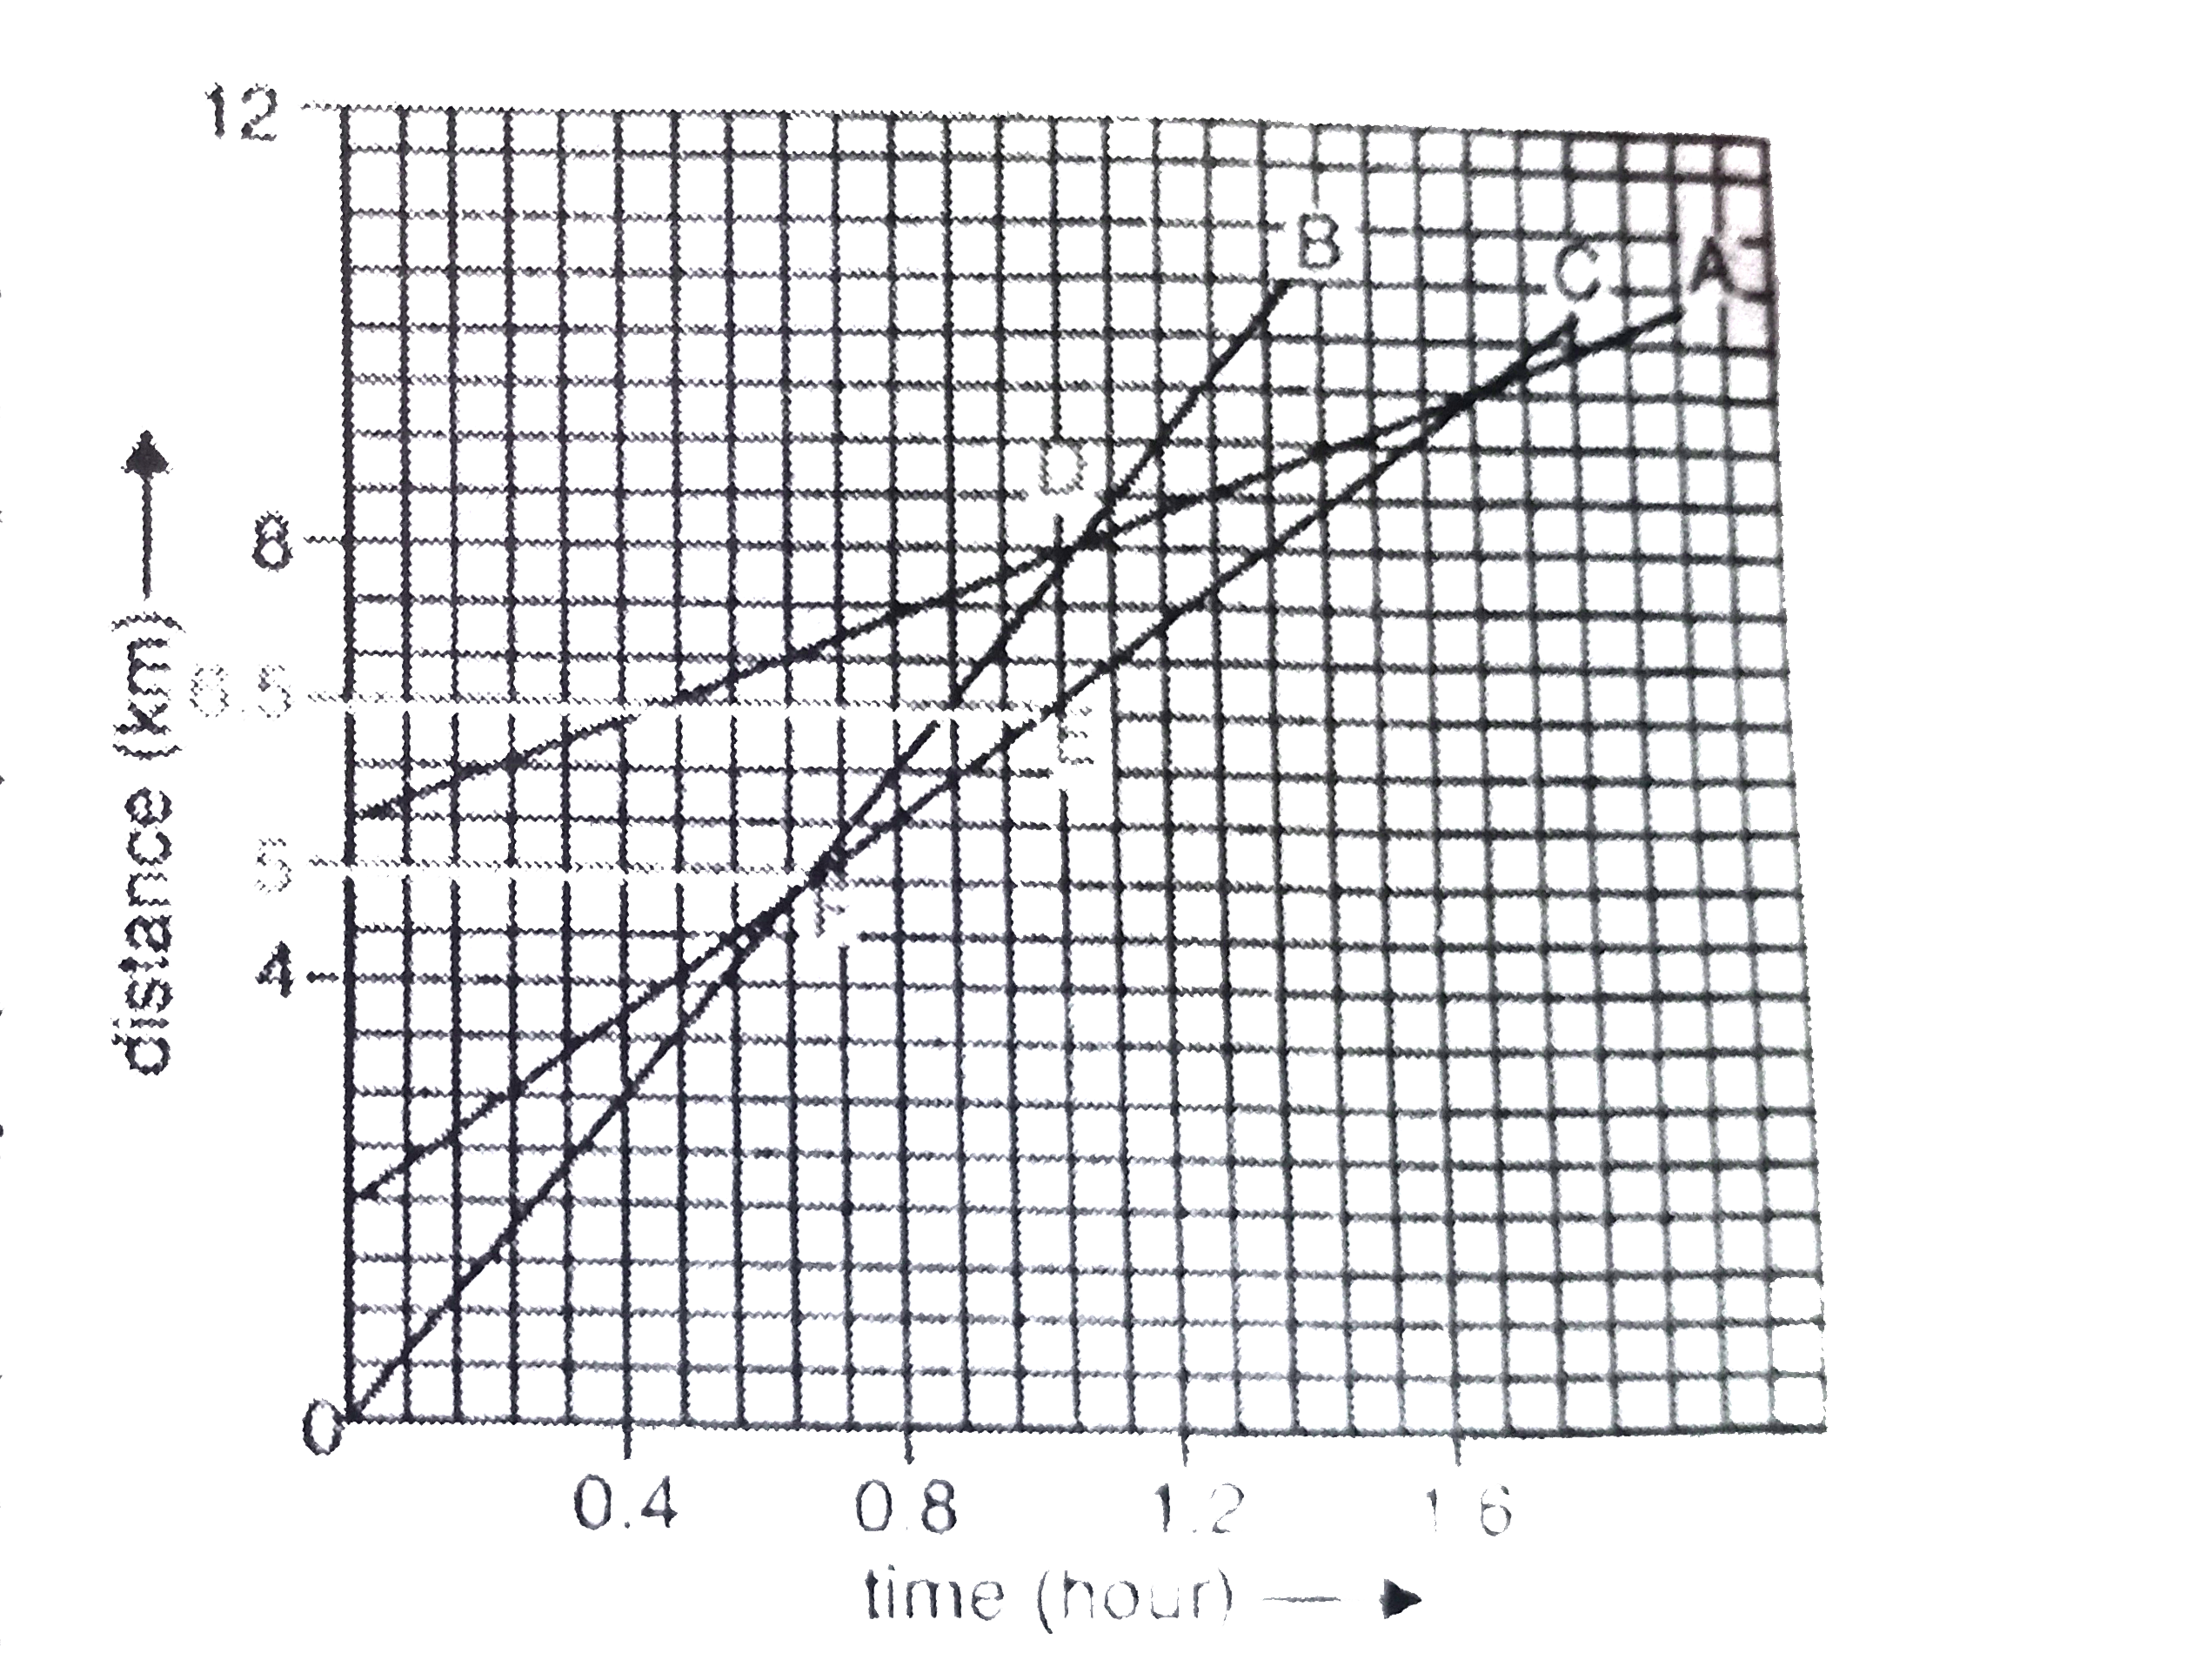
(a) The slope of distance-time graph of a moving object indicates its speed. Greater the slope, higher is the speed. Now, in the given figure, the slope of distance-time graph of object B is the maximum, so the object B is travelling the fastest.
(b) In order to be at the same point on the road, the respective distance and time values for all the three moving objects should be the same. Since the distance-time graph lines of the three objects A, B and C do not cross at a single point, therefore, the three objects are never at the same point on the road.
(c) We can see from the given figure that when B passes A at point D, then the C is at point E. If we locate the distance corresponding to point E on the Y-axis, we find that it is 6.5 km. Thus, C has travelled 6.5 km when B passes A.
(d) The distance-time graphs of B and C meet at point F. If we locate the distance corresponding to point F on the Y-axis, we will find that it is 5 km. Thus, B has travelled 5 km by the time it passes C.