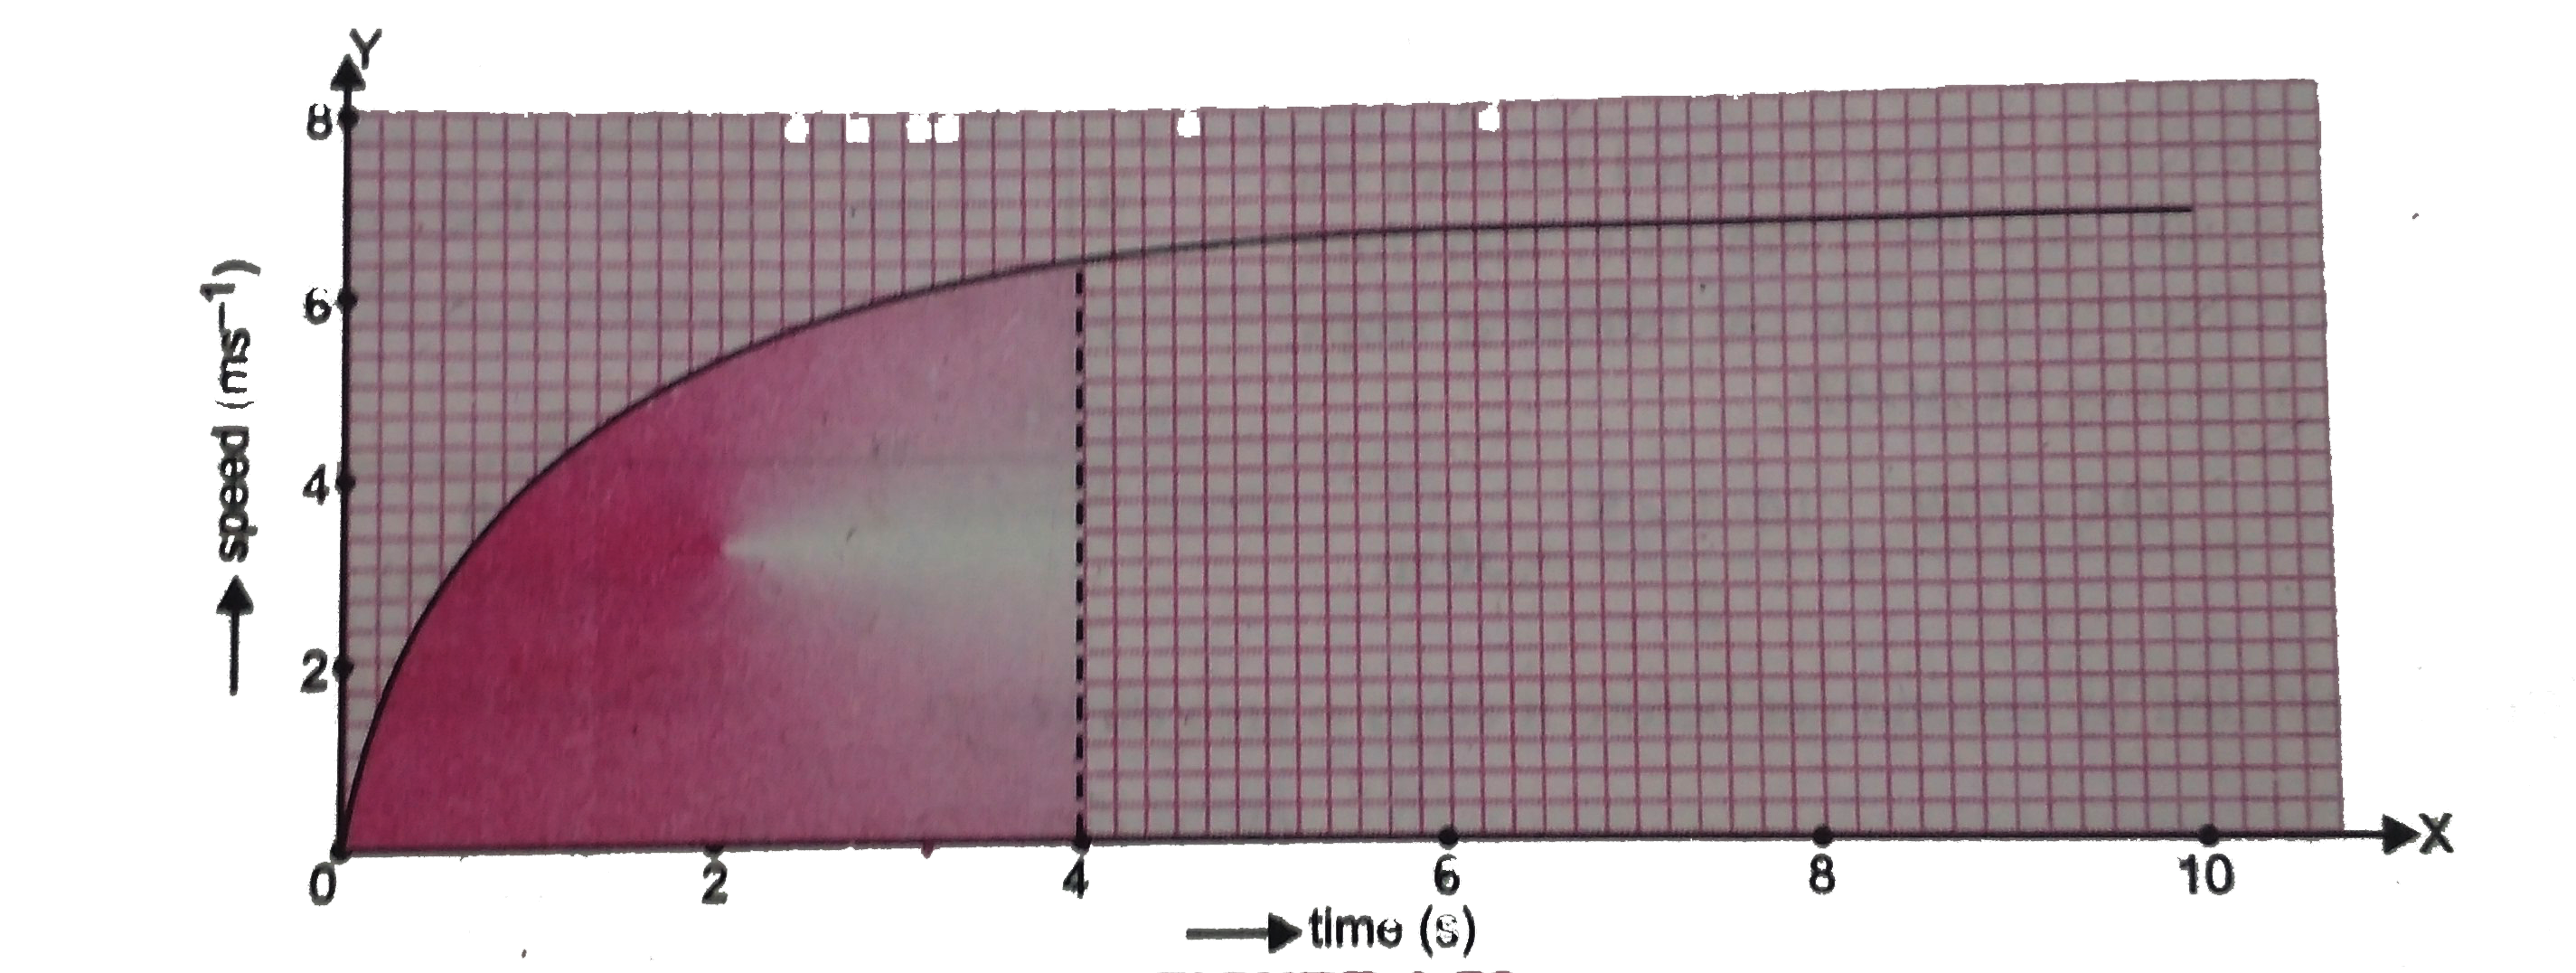
(a) The distance travelled by the car in the first 4 seconds is given by the area between the speed-time curve and the time axis from `t` = 0 to `t` = 4 s. This area of the distance-time graph which represents the distance travelled by the car has been shaded in the graph shown on the next page.
In order to find the distance travelled by the car in the first 4 seconds, we have to count the number of squares in the shaded part of the graph and also calculate the distance represented by one square of the graph paper. While counting the number of squares which are half or more than half are counted as complete squares but the squares which are less than half are not counted. When counted in this way, the total number of squares in the shaded part of the graph is found to be 63.
We will now calculate the distance represented by 1 square of the graph. This can be done as follows : If we look at the X-axis, we find that 5 squares on X-axis represent a time of 2 seconds.
Now, `" "` 5 squares on X-axis = 2 s
So, `" "` 1 square on X-axis = `(2)/(5)` s `" "` ...(1)
Again, if we look at the Y-axis, we find that 3 squares on Y-axis represent a speed of 2 m `s^(-1)`.
Now, `" "` 3 squares on Y-axis = 2 m `s^(-1)`
So, `" "` 1 square on Y-axis = `(2)/(3)`m `s^(-1)` `" "`...(2) ltBrgt Since 1 square on X-axis represents `(2)/(5)` s and 1 square on Y-axis represents `(2)/(3)" m "s^(-1)`, therefore :
`" "` Area of 1 square on graph represents a distance = `(2)/(5)" s"xx(2)/(3)" m "s^(-1)`
`" " =(4)/(15)` m
Now, `" "` 1 square represents distance = `(4)/(15)` m
So, `" "` 63 squares represent distance = `(4)/(15)xx63` m
Thus, the car travels a distance of 16.8 metres in the first 4 seconds.
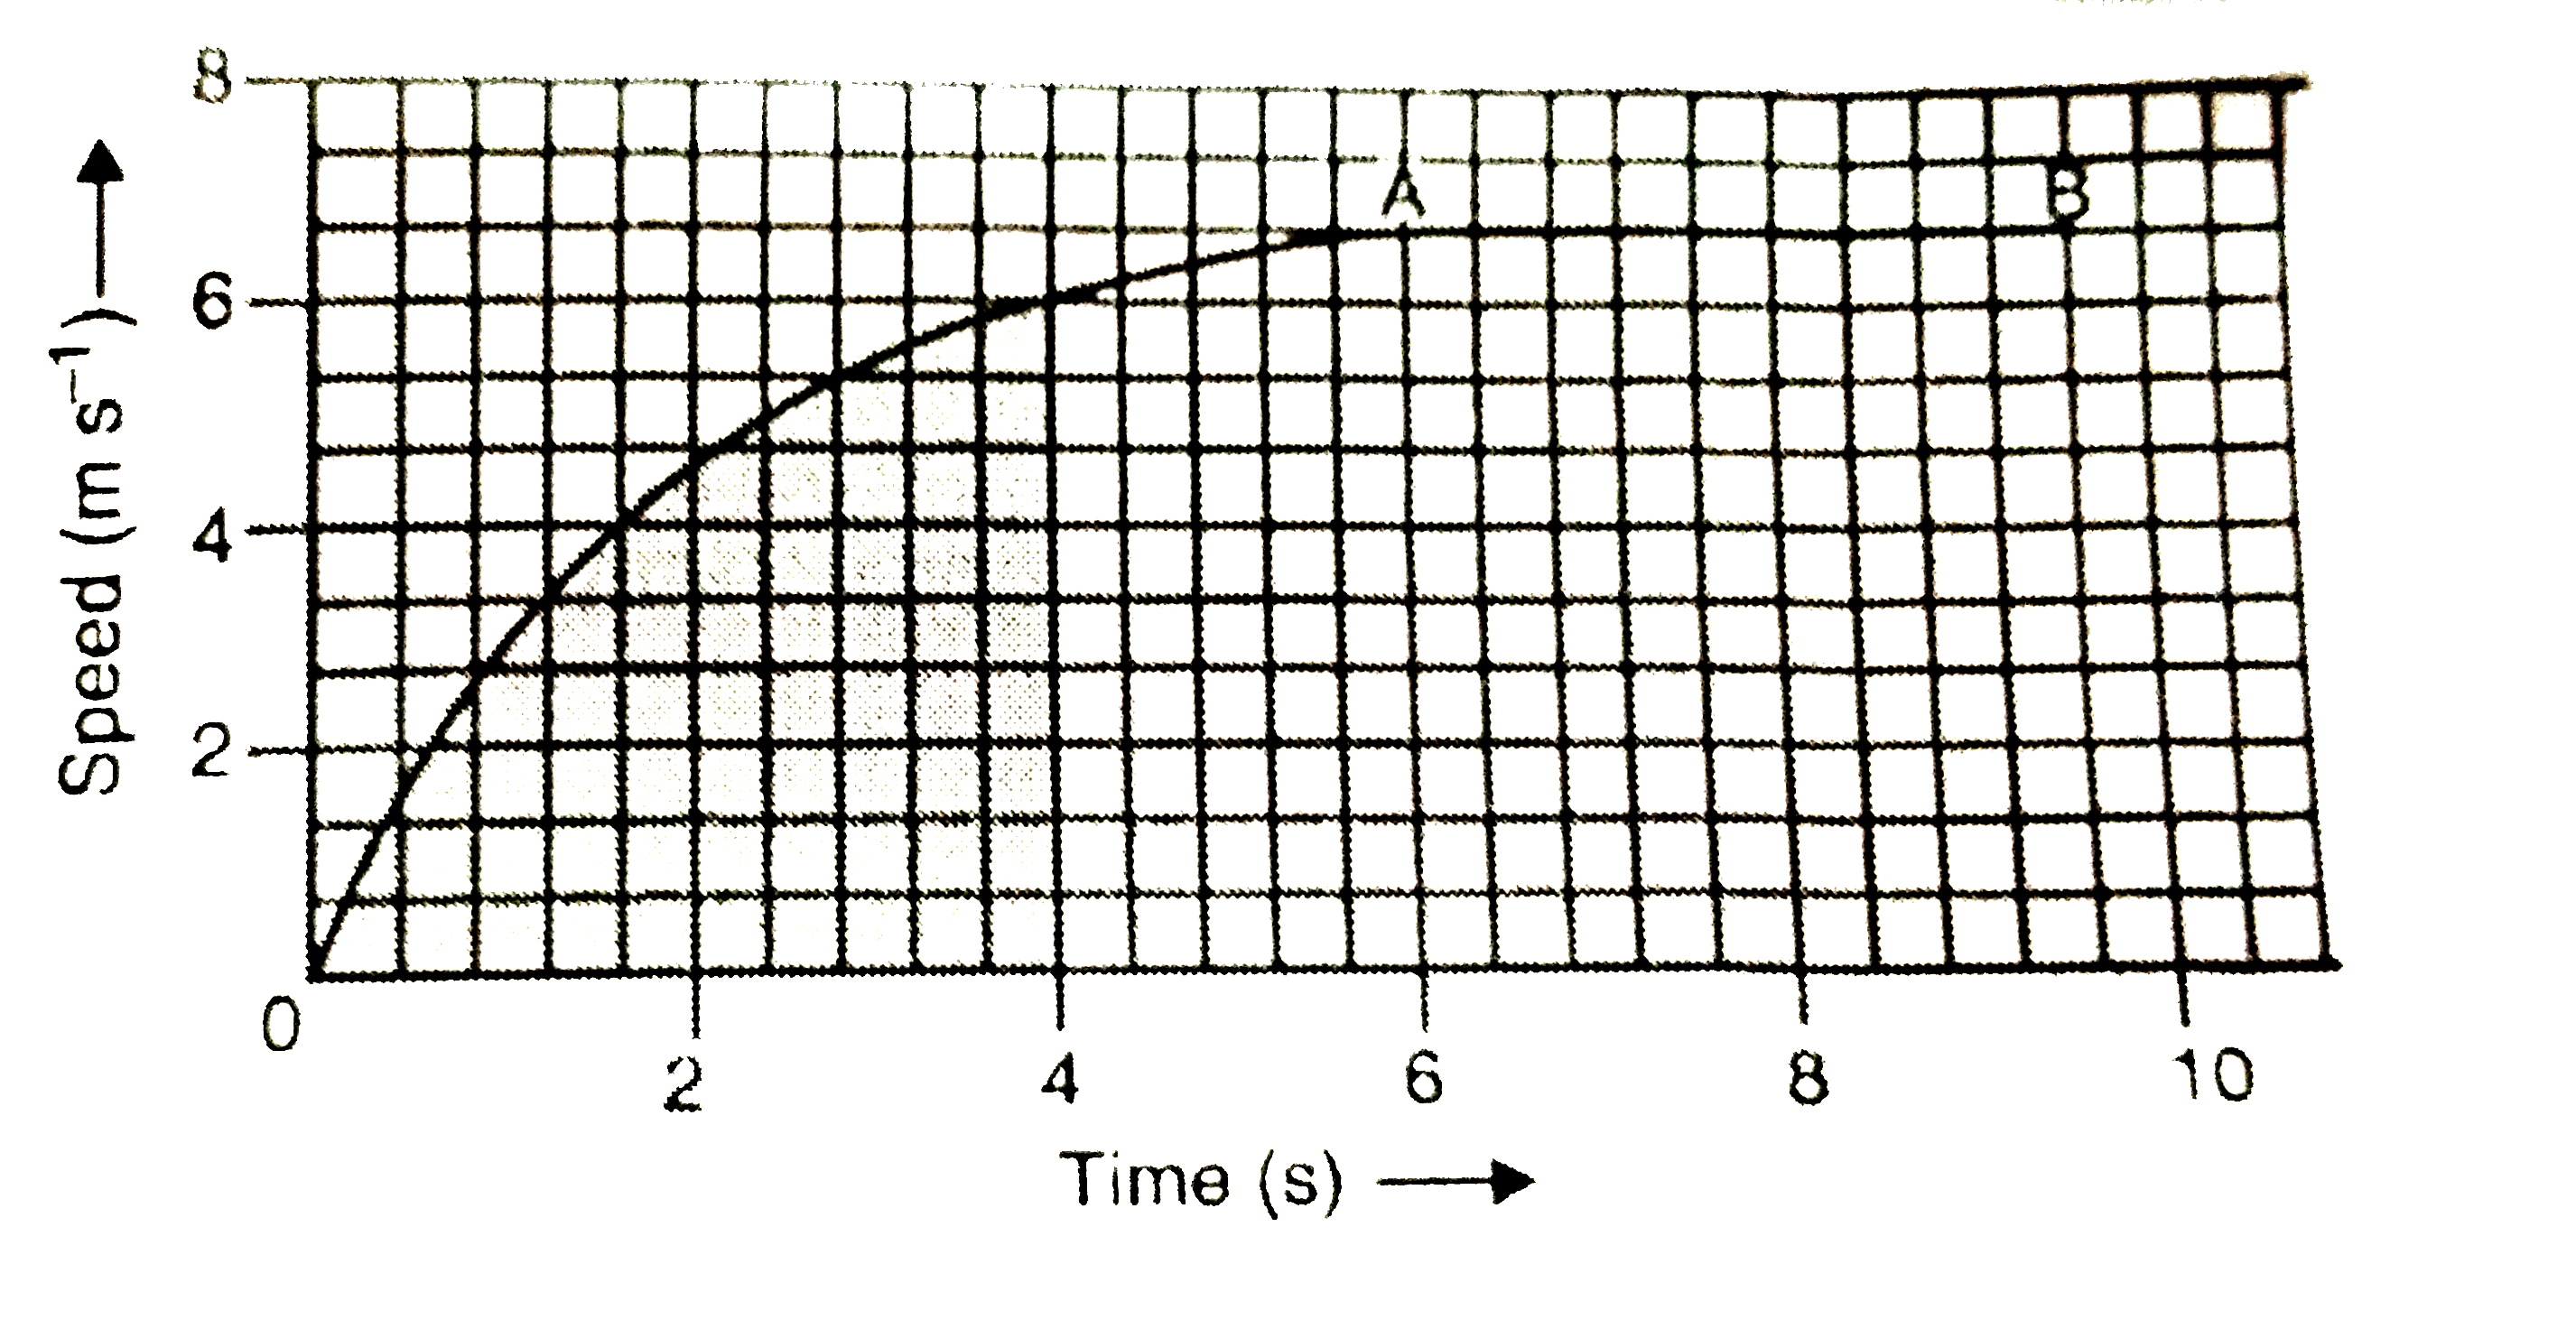
(b) In uniform motion, the speed of car becomes constant. The constant speed is represented by a speed-time graph line which is parallel to the time axis. In the given figure, the straight line graph from `t` = 6 s to `t` = 10 s represents the uniform motion of the car. The part of graph representing uniform motion has been labelled AB.