Text Solution
Verified by Experts
The correct Answer is:


Similar Questions
Explore conceptually related problems
Recommended Questions
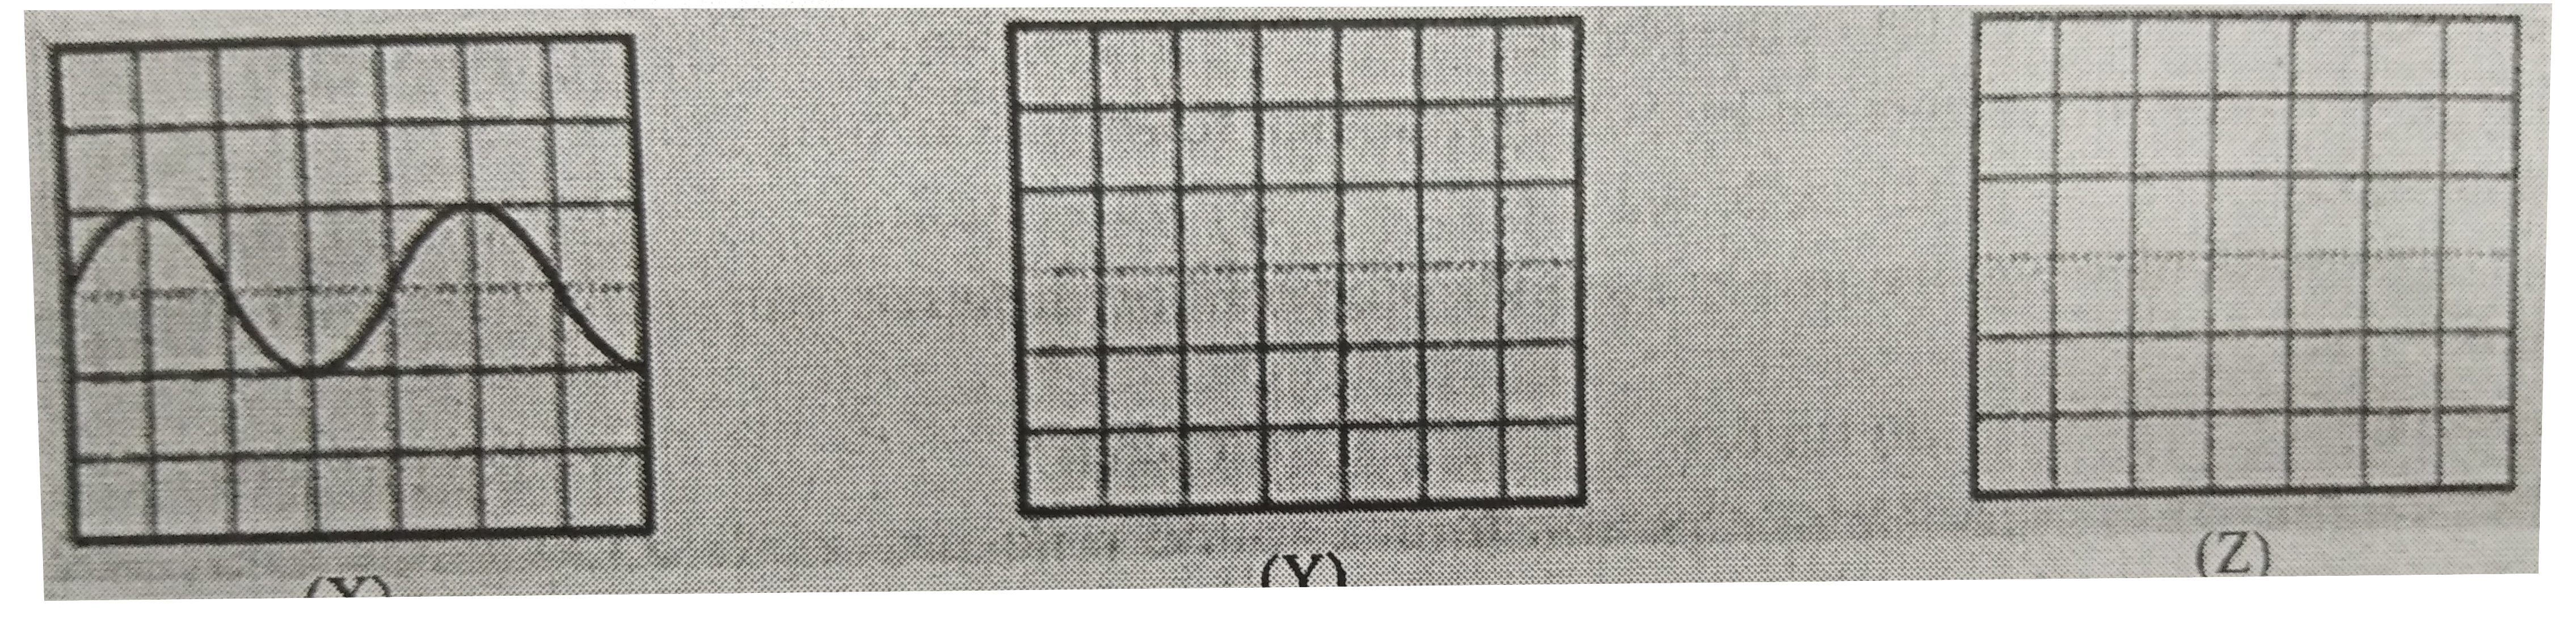
- Figure X shows a trace of a sound wave produced by a particular tuning...
Text Solution
|
- Use tracing paper and centimetre graph paper to compare the areas o...
Text Solution
|
- Corresponding to y - t graph of a transverse harmonic wave shown in fi...
Text Solution
|
- The displacement time graph for two sound waves A and B are shown in t...
Text Solution
|
- An amplitude is frequency graph of a frequency medulatal wave is given...
Text Solution
|
- Figure X shows a trace of a sound wave produced by a particular tuning...
Text Solution
|
- A tuning fork of frequency 250 Hz is vibrating at one end of a tube as...
Text Solution
|
- Which of the following wave phenomenon is not shown by sound wave ?
Text Solution
|
- Corresponding to y - t graph of a transverse harmonic wave shown in fi...
Text Solution
|