Text Solution
Verified by Experts


Topper's Solved these Questions
Similar Questions
Explore conceptually related problems
SUBHASH PUBLICATION-SUPPLEMENTARY EXAM QUESTION PAPER JUNE 2018-QUESTION
- A blue ray of light enters an optically denser medium from air. What h...
Text Solution
|
- ""(92)U^(238) undergoes alpha-decay giving rise to thorium. What is th...
Text Solution
|
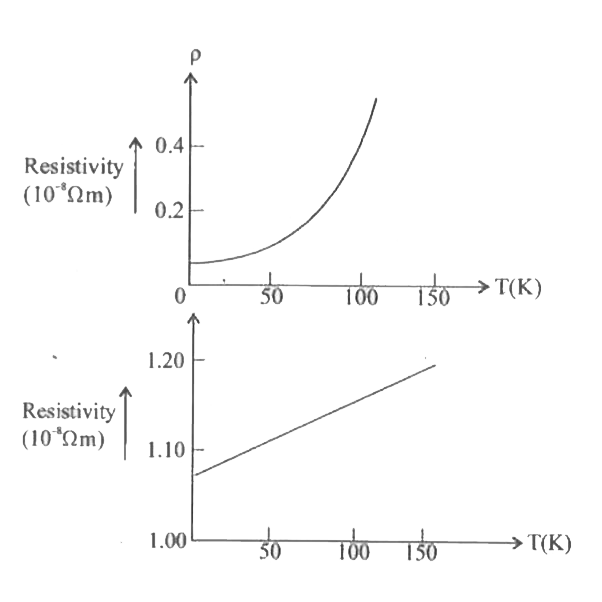
- Represent graphically the variation of resistivity with absolute tempe...
Text Solution
|
- Write an expression for cyclotron frequency and explain the terms .
Text Solution
|
- State and explain 'Curie's Law' in magnetism .
Text Solution
|
- Mention any two factors on which the self inductance of a coil depends...
Text Solution
|
- Give any two applications of ultraviolet radiations.
Text Solution
|
- What is polarisation of light ? Name any one method of producing plane...
Text Solution
|
- Calculate de Broglie wavelength associated with an electron moving wit...
Text Solution
|
- Write any two advantages of Light Emitting Diode (LED) over convention...
Text Solution
|
- Write any three properties of magnetic field lines.
Text Solution
|
- Obtain an expression for effective Capacitance of two Capacitors Conne...
Text Solution
|
- Distinguish between diamagnetic and paramagnetic substances.
Text Solution
|
- Describe the coil and barmagnet experiment to demonstrate the phenomen...
Text Solution
|
- Derive the expression for effective focal length of two thin lenses ke...
Text Solution
|
- Write any three experimental observations of photoelectric effect
Text Solution
|
- Explain the working of a zener diode as a voltage regulator.
Text Solution
|
- What is the function of 'receiver' in communication system ? Draw the ...
Text Solution
|
- Using Gauss's law in electrostatics, obtain an expression for electric...
Text Solution
|
- Derive sigma = (n e^(2) tau)/(m) where the symbols have their usual ...
Text Solution
|