


Similar Questions
Explore conceptually related problems
Recommended Questions
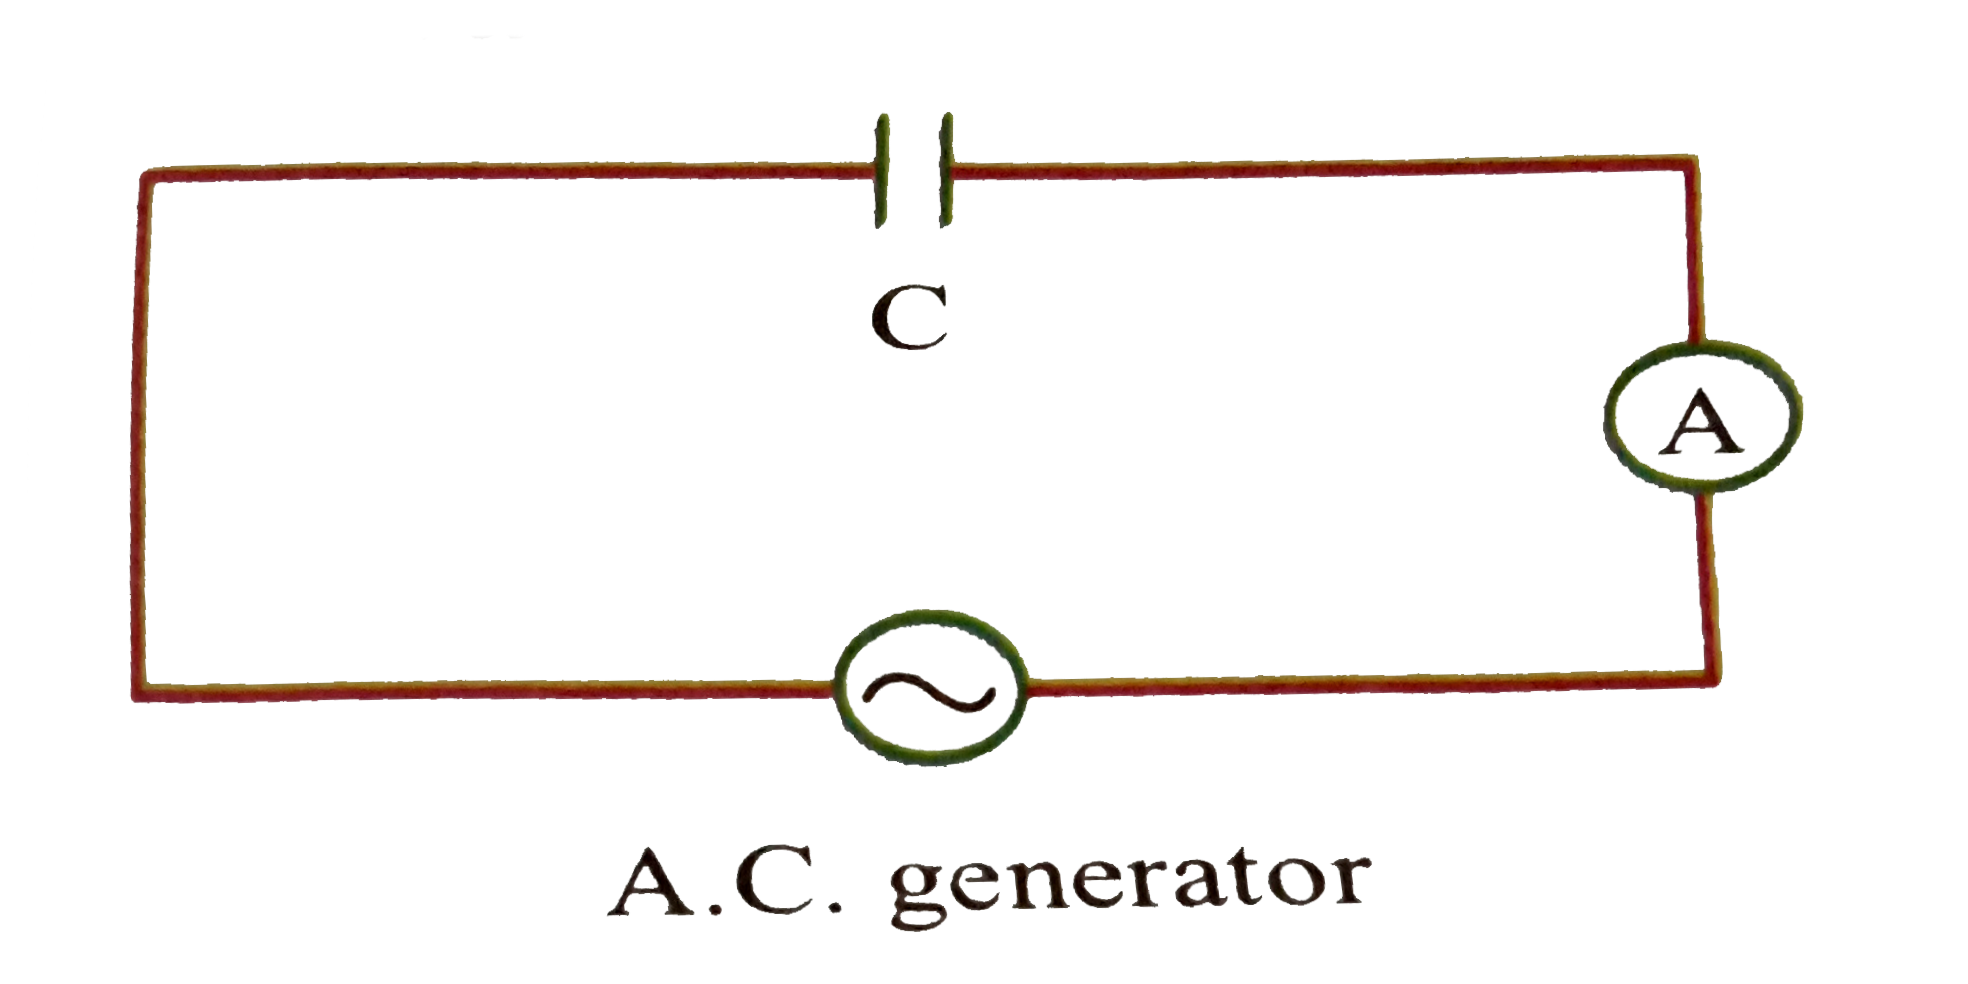
- A constant voltage at different frequencies is applied across a capaci...
Text Solution
|
- Identify the graph which correctly reperesents the variation of capaci...
Text Solution
|
- A constant voltage at different frequencies is applied across a capaci...
Text Solution
|
- Sketch a graph showing the variation of impedance of LCR circuit the f...
Text Solution
|
- The variation of current (I) and voltage (V) is as shown in figure A. ...
Text Solution
|
- A constant voltage at different frequencies is applied across a capaci...
Text Solution
|
- A constant voltage at different frequencies is applied across a capaci...
Text Solution
|
- Explain the term 'capacitive reactance'.Show graphically the variation...
Text Solution
|
- Draw graphs showing variation of photoelectric current with applied vo...
Text Solution
|