


Topper's Solved these Questions
Similar Questions
Explore conceptually related problems
CPC CAMBRIDGE PUBLICATION-PROBABILITY-EXERCISE 15.1
- In a cricket math , a batswoman hits a boundary 6 times out of 30 ball...
Text Solution
|
- 1500 families with 2 children were selected randomly, and the followin...
Text Solution
|
- In a particular section of class IX, 40 students were asked about thhe...
Text Solution
|
- Three coins are tossed simultaneously 200 times with the following fre...
Text Solution
|
- An organization selected 2400 families at random and surveyed them to ...
Text Solution
|
- (i) Find the probability that a student obtained less than 20% in the ...
Text Solution
|
- To know the opinion of the students about the subject statistics , a s...
Text Solution
|
- Distance (in km) of 40 engineers from their place of residence to thei...
Text Solution
|
- Eleven bags of wheat flour, each marked 5 kg actually contained the fo...
Text Solution
|
- A study was conducted to find out the concentration of sulphur dioxide...
Text Solution
|
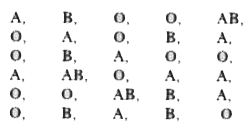
- The blood groups of 30 students of class VIII are recorded as follows ...
Text Solution
|