Text Solution
Verified by Experts


Similar Questions
Explore conceptually related problems
Recommended Questions
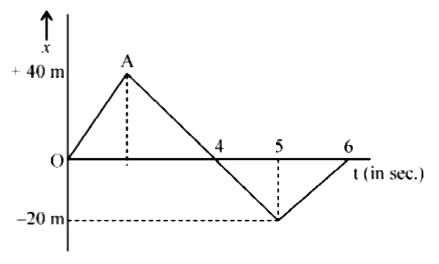
- s-t graph of a particle in motion is shown in Fig. Calculate Tota...
Text Solution
|
- The velocity-tiem graph of a particle movitgn along a straight line is...
Text Solution
|
- The x-t graph of a particle undergoing simple harmonic motion is shown...
Text Solution
|
- The x-t graph of a particle undergoing simple harmonic motion is shown...
Text Solution
|
- Position-time graph of a particle in motion is shown in fig. Calculate...
Text Solution
|
- s-t graph of a particle in motion is shown in Fig. Calculate Total cov...
Text Solution
|
- s-t graph of a particle in motion is shown in Fig. Calculate Disp...
Text Solution
|
- s-t graph of a particle in motion is shown in Fig. Calculate Aver...
Text Solution
|
- s-t graph of a particle in motion is shown in Fig. Calculate Aver...
Text Solution
|