Text Solution
Verified by Experts


Similar Questions
Explore conceptually related problems
Recommended Questions
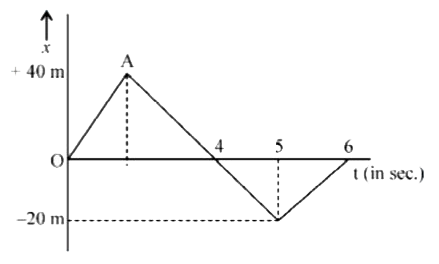
- s-t graph of a particle in motion is shown in Fig. Calculate Aver...
Text Solution
|
- s-t graph of a particle in motion is as shown below. (a) State, whethe...
Text Solution
|
- Velocity time graph for the motion of a particle along a straight line...
Text Solution
|
- s-t graph of two particles A and B are shown in fig. Find the ratio of...
Text Solution
|
- Position-time graph of a particle in motion is shown in fig. Calculate...
Text Solution
|
- A particle obeys the following v - t graph as shown. The average veloc...
Text Solution
|
- s-t graph of a particle in motion is shown in Fig. Calculate Total cov...
Text Solution
|
- s-t graph of a particle in motion is shown in Fig. Calculate Disp...
Text Solution
|
- s-t graph of a particle in motion is shown in Fig. Calculate Aver...
Text Solution
|