A
B
C
D
Text Solution
Verified by Experts
The correct Answer is:


Similar Questions
Explore conceptually related problems
Recommended Questions
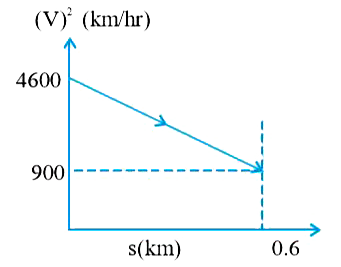
- A graph between the square of the velocity of a particle and the dista...
Text Solution
|
- Acceleration (a) -displacement (s) graph of a particle moving in a str...
Text Solution
|
- A graph between the square of the velocity of a particle and the dista...
Text Solution
|
- Acceleration-velocity graph of a moving particle is shown in figure. T...
Text Solution
|
- A particle moves in straight line. Acceleration of particle changes wi...
Text Solution
|
- A graph between the square of the velocity of a particle and the dista...
Text Solution
|
- A graph between the square of the velocity of a particle and the dista...
Text Solution
|
- A particle is moving on a straight line such that square of its veloci...
Text Solution
|
- The acceleration - time graph for a particle moving along x - axis is ...
Text Solution
|